Are you interested in investing in the tech industry? If so, we bring you two of the biggest players in the game: AMD and NVIDIA. These two companies have seen, considerably, impressive growth in 2023, but which represents the better chip stock?
Looking at numbers can give a better idea of which company is performing better in the market. However, it’s not just about the numbers. The strength of these companies differ, and also, the risks they carry, such as high PE ratios.
This comparison aims to determine which company is the better chip stock by numbers. Also, we will take into account factors such as performance, pricing, and market share. While the question remains which is the better buy? Let’s take a closer look at AMD vs. NVIDIA and find out.
Key Statistics: AMD vs NVIDIA
- Nvidia slightly edges out AMD in power, while AMD takes the lead in terms of competitive pricing.
- Selecting a GPU is less about the brand and more about aligning with your personal preferences and computational requirements, and determining which top-tier graphics card meets those needs.
- The RTX 4060 Ti takes the lead as the top-performing GPU, with the RTX 4070, RTX 3060 Ti, RTX 4070 Ti, RTX 3070, and RTX 3060 trailing closely behind.
- AMD is poised to challenge Nvidia for the top performance title, though the professional sector might not be prepared for their arrival just yet.
- For cost-effective FPS per dollar ray tracing, the Arc A750 leads, followed by the RTX 3060 Ti, RTX 4070, RTX 3060, and Arc A770 8GB. AMD’s RX 6600 ranks ninth in DXR value, but the RX 6700 10GB is a better choice due to its superior DXR performance.
- In 2023, Nvidia’s stock experienced a remarkable surge of 214%, whereas AMD’s shares saw a more modest increase of 72%.
- Nvidia holds a leading position in the data center GPU market, whereas AMD plays a more minor role in this sector.
- Experts predict that Nvidia’s profits will rise by 33% this fiscal year, reaching $4.46 per share.
- Conversely, AMD’s financial performance is projected to decline in 2023.
- AMD’s graphics card delivers a gaming performance that’s 25-35% superior to the Nvidia 3050 in typical scenarios.
- AMD’s economical GPUs, like the RX 5500 XT, deliver impressive performance for a reasonable cost.
- The Nvidia RTX 3080 distinctly overshadows all that AMD presents.
- Nvidia’s valuation is approximately triple that of AMD.
- AMD and Nvidia consistently rival each other in the gaming sector.
Direct Stock Performance Comparison
Analysts concur that AMD might outpace NVIDIA in near-term growth. However, it’s crucial to recognize that each company possesses unique advantages and associated risks. Let’s delve into their comparative analysis.8
NVIDIA
In the first quarter of 20233, NVIDIA reported revenues of USD$7.192 million.
- Year-to-Date Growth
As of August 16, 20231, NVIDIA has experienced a remarkable year-to-date growth of 197.65%.
NVIDIA’s growth has significantly stemmed from the demand for its AI chips. The company leads in AI technology, and as more industries adopt AI, the demand for their products has surged.
AMD
In the second quarter of 20234, AMD reported a revenue of USD$5.359 million.
- Year-to-Date Growth
AMD’s year-to-date growth up to August 16, 20232, stands at an impressive 78.50%.
The growth of AMD resulted from its Data Center and Embedded business segments, which experienced notable revenue increases.
AMD vs. NVIDIA: Historical Stock Price Trend
AMD and NVIDIA design micro-chips, and their stock prices have varied throughout the years. The historical stock price data of these two companies over the year are compared below:
| Year | NVIDIA Avg. Stock Price ($)5 | AMD Avg. Stock Price ($)6 |
| 2014 | 4.42 | 3.66 |
| 2015 | 5.75 | 2.33 |
| 2016 | 13.22 | 5.26 |
| 2017 | 37.04 | 12.41 |
| 2018 | 57.61 | 17.22 |
| 2019 | 43.41 | 29.94 |
| 2020 | 98.64 | 65.62 |
| 2021 | 194.93 | 101.15 |
| 2022 | 185.53 | 90.89 |
| 2023 | 309.11 | 96.87 |
The Graphical Anatomy

Stock prices for firms like AMD and NVIDIA are affected by numerous factors. Among these determinants are product introductions, fiscal outcomes, and GPU market appetite. The tech sector’s rivalry, global economic trends, investor views, and unforeseen events such as geopolitical tensions all play a role in shaping the stock market’s unpredictable behaviour.
Key Stock Price Milestones
AMD and NVIDIA have had their ups and downs in the stock market, with various factors affecting their valuations and potential for growth. However, some of the key stock price milestones are the following.
AMD
- In June 2023, many viewed AMD’s stock as a more dependable purchase than NVIDIA’s because of its lower cost.
- In June 20237, the absence of software integration in AMD’s strategy emerged as a significant weakness, potentially hindering its growth.
- In April 20239, AMD’s forward price-to-earnings ratio stood at 18, while NVIDIA’s was 44, showing that AMD’s stock offered better value.
- In August 20228, analysts believed that for market valuations to align, either AMD’s stock should rise or NVIDIA’s should drop.
- In November 2019, experts predicted that AMD’s stock might yield returns comparable to NVIDIA’s over the subsequent 12 to 18 months.
NVIDIA
- In June 20237, NVIDIA approached a valuation of $1 trillion, joining the elite ranks of Apple, Microsoft, and Alphabet.
- In August 20228, NVIDIA reduced its projections due to a slump in gaming demand, whereas AMD was on track to meet its financial goals because of robust demand in data centers.
- By April 20239, NVIDIA’s forward price-to-earnings ratio stood at 44, while AMD’s was at 18, showing that NVIDIA’s stock commanded a higher value.
- In November 2019, NVIDIA’s stock traded over 80 points below its high from the previous year, which was $292.76. At the same time, AMD had reached a 13-year peak and was nearing its all-time high from 2000 in the upper $40s.
Sources: Finance Charts1, Barchart2, Macrotrends3, Macrotrends4, Macrotrends5, Macrotrends6, The Motley Fool, The Motley Fool7, Seeking Alpha8, Nasdaq9, Investopedia
NVIDIA vs. AMD: The Financial Health
Metrics such as revenue, profit, debt-to-equity ratio, return on equity, and others are utilized to gauge the financial well-being of these major tech firms. In this segment, we’ll concentrate solely on the afore-mentioned indicators.
Revenues for the Last Decade
Here are the stock revenues for NVIDIA and AMD over the last decade.
| Year | NVIDIA Stock Revenues($m)1 | AMD Stock Revenues($m)2 |
| 2013 | 4.28 | 5.30 |
| 2014 | 4.13 | 5.51 |
| 2015 | 4.68 | 3.99 |
| 2016 | 5.01 | 4.32 |
| 2017 | 6.91 | 5.25 |
| 2018 | 9.71 | 6.48 |
| 2019 | 11.72 | 6.73 |
| 2020 | 10.92 | 9.76 |
| 2021 | 16.68 | 16.43 |
| 2022 | 26.91 | 23.60 |
The Graphical Anatomy
- NVIDIA

- AMD

Over the past decade, NVIDIA and AMD experienced significant revenue growth. While NVIDIA typically led, AMD significantly narrowed the gap by 2021. Both companies excelled in 2021 and 2022, suggesting a flourishing market or effective strategies. Recently, AMD has been increasingly competitive in revenue against NVIDIA.
The Debt-to-Equity Ratio for Previous Quarters
The debt-to-equity ratio gauges a company’s financing from debt versus equity. A higher ratio shows more reliance on debt, while a lower one indicates a preference for equity. Let’s delve into the examination of the ratios observed during the previous ten quarters.
Quarters Evaluations: The first quarter of 2023 downwards.
| Year | NVIDIA Debt to Equity Ratio3 | AMD Debt to Equity Ratio4 |
| Q4 2020 | 0.70 | 0.54 |
| Q1 2021 | 0.64 | 0.55 |
| Q2 2021 | 0.83 | 0.51 |
| Q3 2021 | 0.71 | 0.56 |
| Q4 2021 | 0.66 | 0.66 |
| Q1 2022 | 0.72 | 0.21 |
| Q2 2022 | 0.82 | 0.22 |
| Q3 2022 | 0.90 | 0.24 |
| Q4 2022 | 0.86 | 0.23 |
| Q1 2023 | 0.81 | 0.24 |
The Graphical Anatomy
- NVIDIA

From the graph, it’s evident that NVIDIA’s debt-to-equity ratio has seen fluctuations over the quarters, with a general upward trend, especially from Q4 2021 to Q3 2022. This suggests an increasing reliance on debt for financing during this period.
- AMD
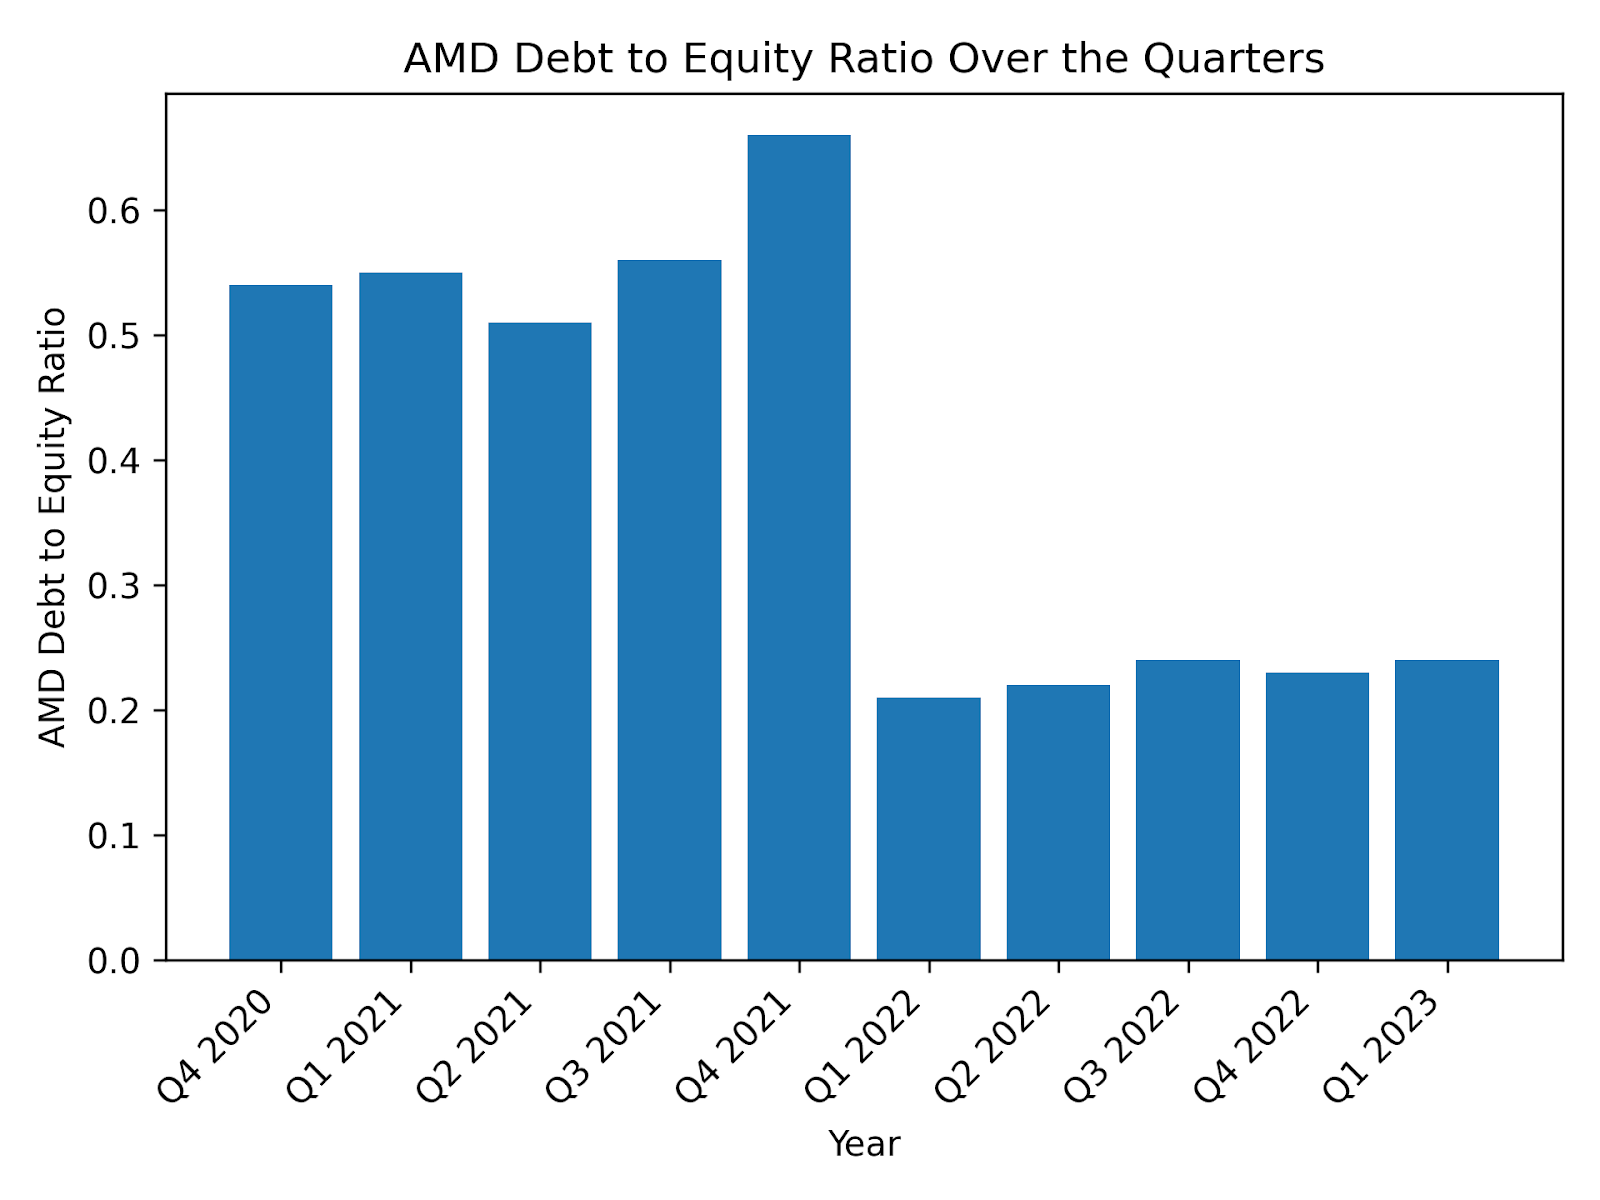
The graph highlights a significant drop in the debt-to-equity ratio for AMD starting from Q1 2022. This indicates a shift in their financing strategy or a change in their financial position during this period.
While both companies operate in the tech industry, they have showcased different financing strategies over the past ten quarters. NVIDIA leaned more towards debt, while AMD shifted its approach to rely more heavily on equity in the recent quarters.
Return on Equity for Previous Quarters
Return on Equity (ROE) measures a company’s profitability against its shareholders’ equity, indicating its efficiency in using equity for profit. A higher ROE shows effective profit generation, while a lower one suggests inefficient equity use.
Quarters Evaluations: The first quarter of 2023 downwards.
| Year | NVIDIA Return on Equity5 | AMD Return on Equity6 |
| Q4 2020 | 29.25% | 3.27% |
| Q1 2021 | 32.82% | 7.33% |
| Q2 2021 | 39.25% | 10.23% |
| Q3 2021 | 40.72% | 12.15% |
| Q4 2021 | 43.18% | 15.23% |
| Q1 2022 | 38.65% | 17.44% |
| Q2 2022 | 30.78% | 18.60% |
| Q3 2022 | 24.28% | 20.89% |
| Q4 2022 | 18.66% | 20.78% |
| Q1 2023 | 20.88% | 18.37% |
The Graphical Anatomy
- NVIDIA
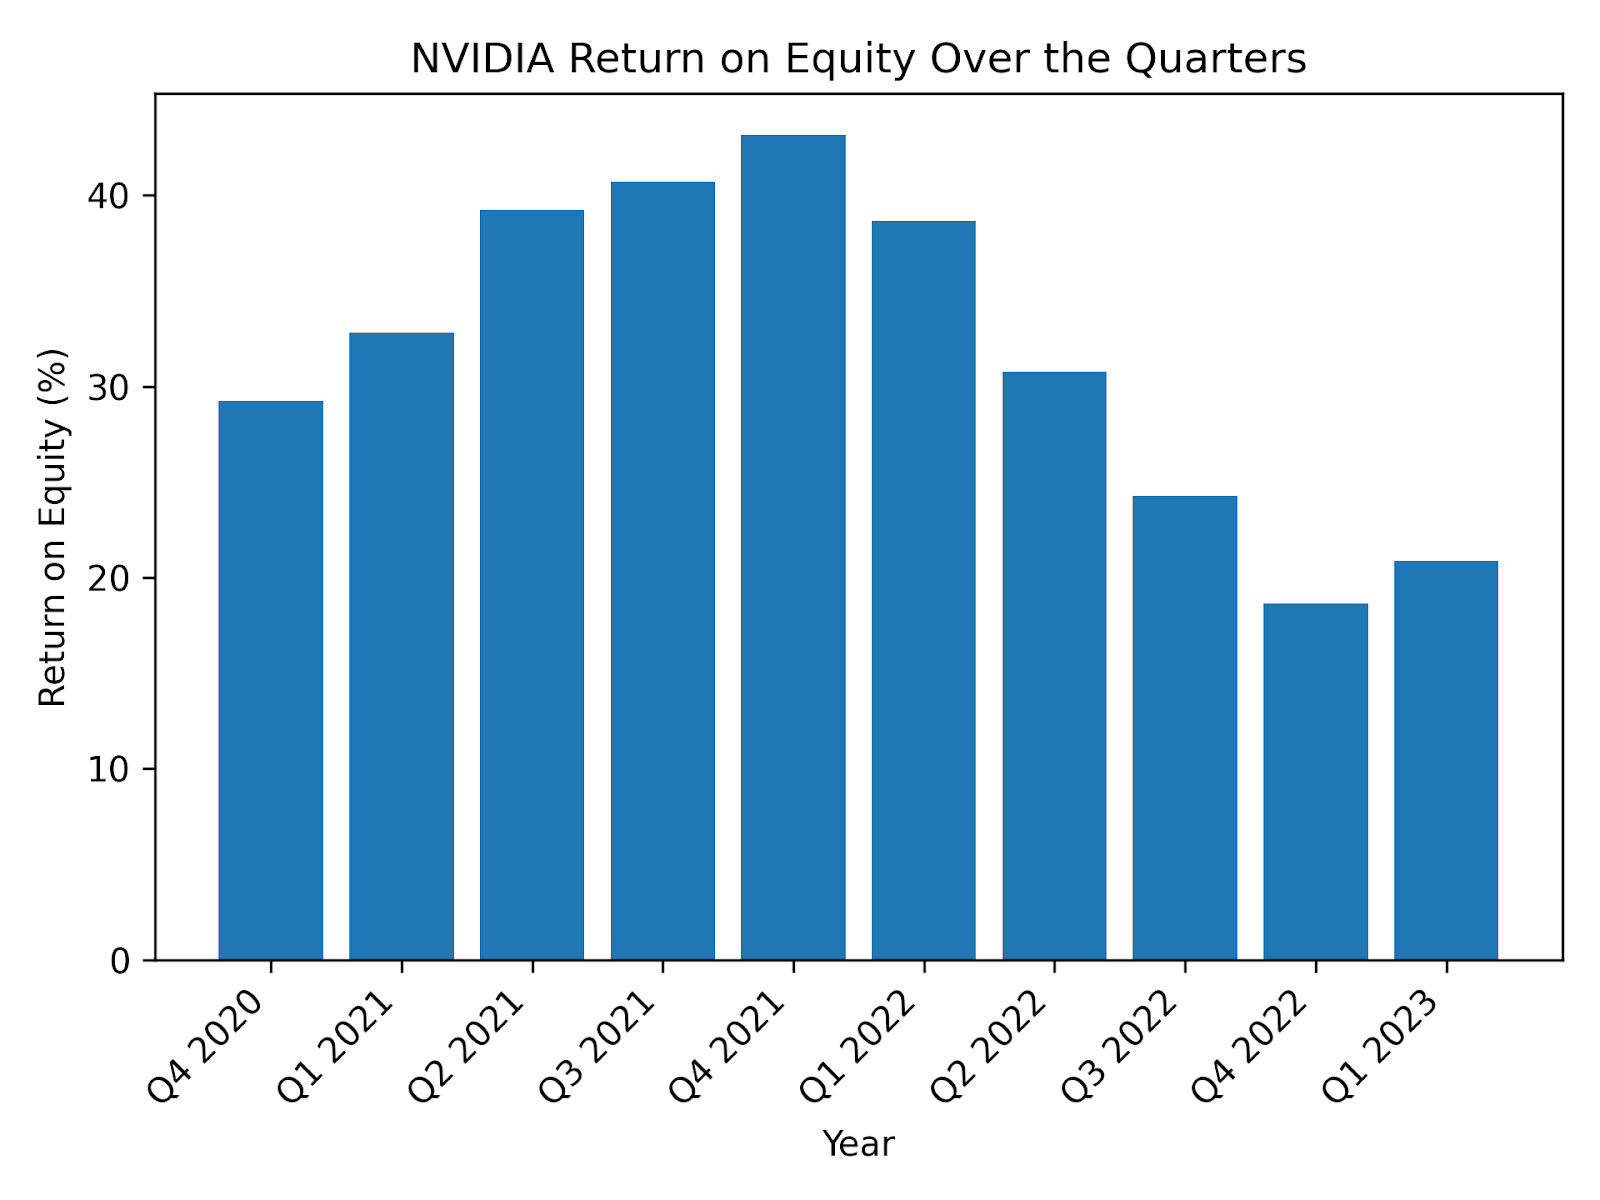
This trend is evidence that NVIDIA was highly efficient in using its equity to generate profits during 2021. However, there was a decline in this efficiency in 2022, with a slight recovery at the start of 2023.
- AMD
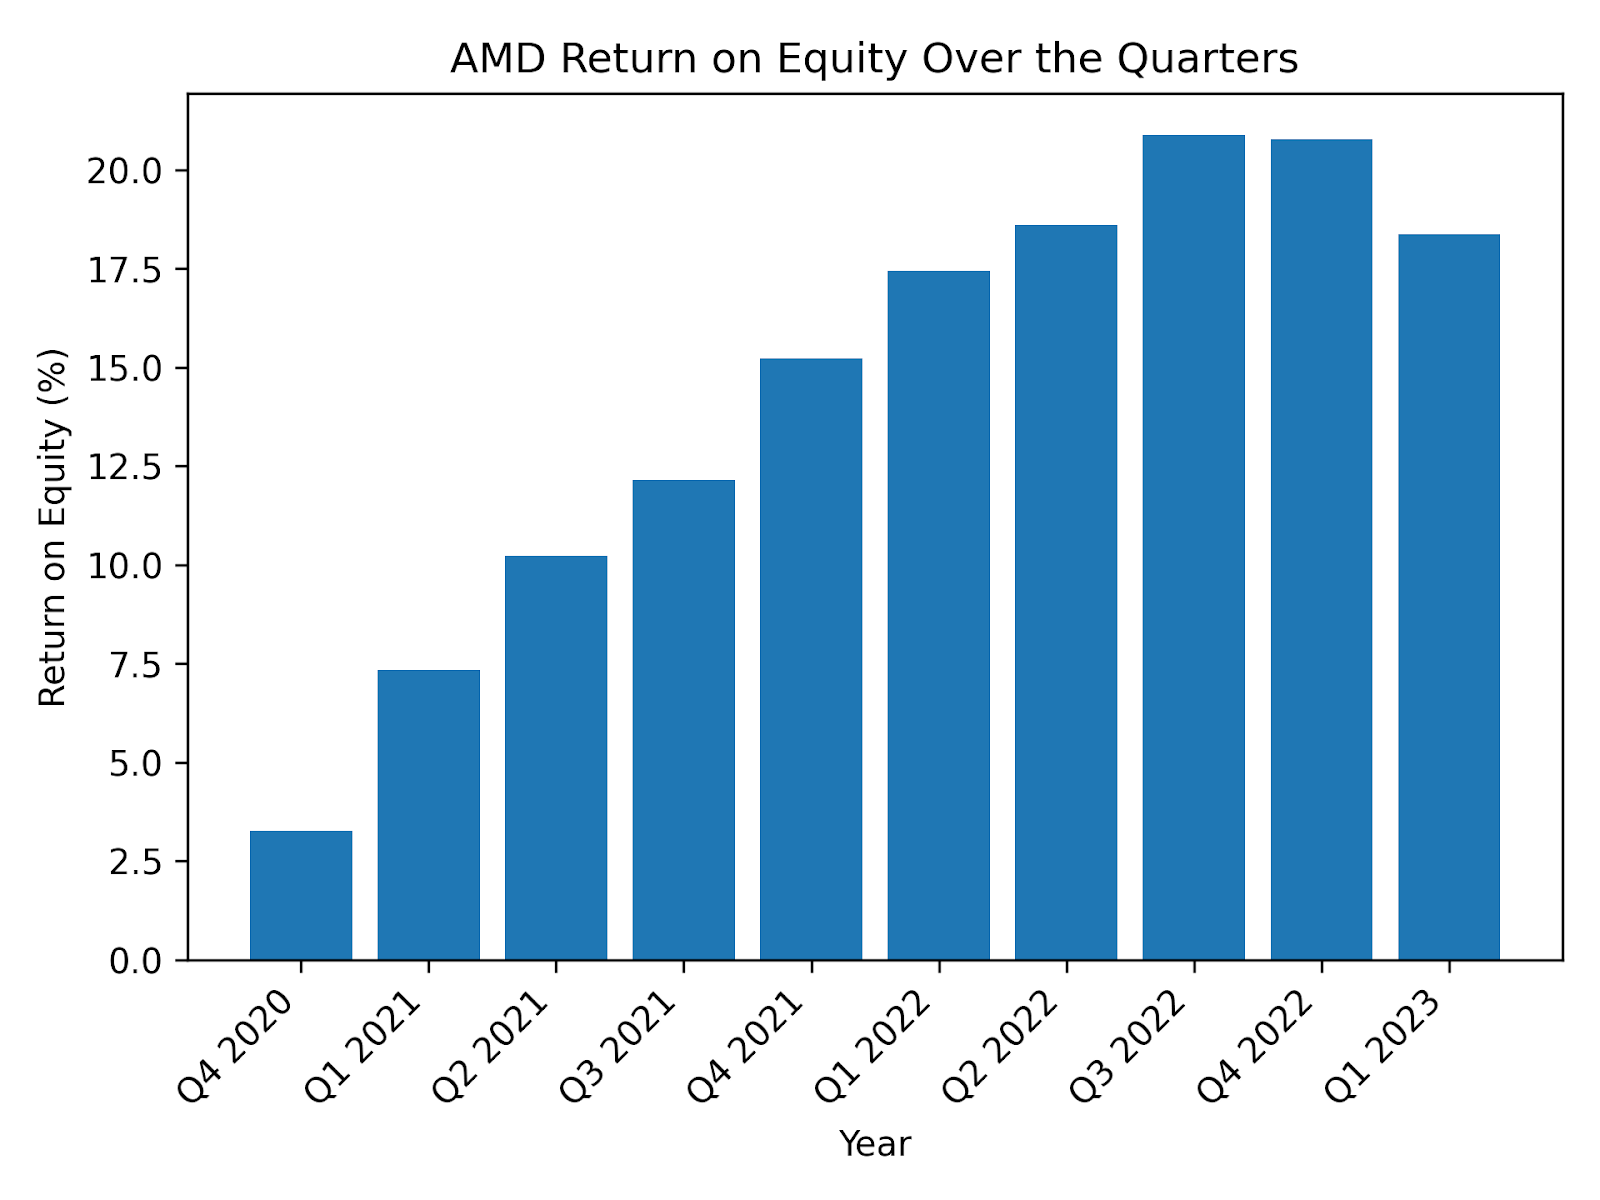
The data suggests that AMD has been progressively improving its efficiency in terms of profit generation from its equity. However, there was a slight decline in the most recent quarter.
While NVIDIA started with a much higher ROE, its efficiency in generating profits from equity decreased in the latter quarters. In contrast, AMD consistently improved its efficiency over the same period, despite starting from a lower base.
Sources: Macrotrends1, Macrotrends2, Macrotrends3, Macrotrends4, Macrotrends5, Macrotrends6,
NVIDIA vs. AMD: Market Share and Growth
NVIDIA and AMD both earn revenues from Data Centers, Autonomous Vehicles, Gaming, among other sectors. However, they have distinct market shares and growth patterns. The subsequent data offers a clear differentiation.
Market Share
The data below highlights the market share of NVIDIA and AMD during the fourth quarters from 2016 to 2022.
| Quarters (Q4) | NVIDIA (%) | AMD (%) |
| 20161 | 70.5 | 29.5 |
| 20171 | 66.3 | 33.7 |
| 20181 | 81.2 | 18.8 |
| 20191 | 68.92 | 31.08 |
| 20201 | 83.00 | 17.00 |
| 20212 | 88.00 | 8.00 |
| 20223 | 84.00 | 11.00 |
The Graphical Anatomy Using the Spider Plot

While both NVIDIA and AMD are key players in their industry, NVIDIA has managed to maintain a dominant position over the years. AMD, despite its fluctuations, remains a significant competitor, showcasing resilience and potential for growth.
Market Growth
The market growth reflects how much the market has expanded over a given period. A growing market can indicate increased consumer interest, effective marketing, or new product introductions. Otherwise, declining market growth might suggest market saturation, increased competition, or external industry challenges.
Below is the table representing the NVIDIA and AMD market growth over a given period of three years.
| Yearly Growth | NVIDIA (%) | AMD (%) |
| 2019-2020 | 52.63% | 45.05% |
| 2020-2021 | 61.4% | 68.33% |
| 2021-2022 | 0.22% | 43.61% |
Graphical Anatomy

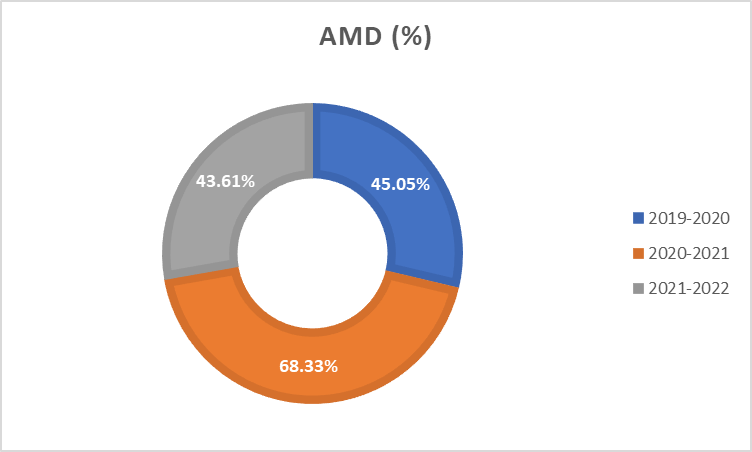
NVIDIA saw robust growth until 2020 but sharply declined in 2021-2022 to just 0.22%. AMD consistently grew, peaking in 2020-2021 at 68.33% and outpacing NVIDIA in recent years. Overall, NVIDIA’s growth slowed, while AMD’s remained strong.
Sources: Business Quant1, Seeking Alpha2, Tom’s Hardware3, Macrotrends4, Macrotrends5
AMD vs. NVIDIA: Product Innovations and Roadmap
Similar to NVIDIA, AMD has introduced numerous product innovations that influenced its stock prices. We will analyse these product innovations and roadmaps of both companies in the following sub-headings.
NVIDIA
From 2017 to 2023, NVIDIA primarily sourced its revenue from gaming, automotive, data centers, and professional visualisation. All these revenue figures are presented in $millions in the table below.
| Years | Gaming | Automotive | Data Center | Professional Vis. | OEM&Others |
| 20171 | 4.06 | 0.487 | 0.830 | 0.835 | 0.98 |
| 20181 | 5.513 | 0.558 | 1.932 | 0.934 | 0.777 |
| 20191 | 6.246 | 0.641 | 2.932 | 1.130 | 0.767 |
| 20201 | 5.518 | 0.700 | 2.983 | 1.212 | 0.505 |
| 20211 | 7.759 | 0.536 | 6.696 | 1.053 | 0.631 |
| 20221 | 12.462 | 0.566 | 10.613 | 2.111 | 1.162 |
| 20231 | 9.067 | 0.903 | 15.005 | 1.544 | 0.455 |
NVIDIA’s primary revenue driver is its gaming segment, followed closely by its rapidly growing data center segment. While the gaming revenue looks like a dip in the ongoing 2023, the data center revenue continued its upward trajectory. This highlights NVIDIA’s expanding presence in that sector.
The other segments have seen fluctuations, with the automotive and professional visualisation sectors showing potential growth areas. The OEM & Others segment, however, seems to be more volatile.
AMD
Based on AMD’s 2022 financial results, the company actively showcases its strength across four key segments: Gaming, Clients, Embedded, and Data Center. The table below provides the revenue for the year in these segments.
| Segments | Revenues ($)2 |
| Data Center | 1.7 billion |
| Gaming | 1.6 billion |
| Clients | 903 million |
| Embedded | 1.4 billion |
In 2022, AMD demonstrated a diversified and robust revenue portfolio. The Data Center and Gaming segments were the primary drivers of their revenue, highlighting the company’s strong foothold in these markets.
The substantial revenue from the Embedded segment also indicates AMD’s versatility and wide-ranging market presence. While the Clients segment generated the least revenue, it remains a significant part of AMD’s business.
AMD vs. NVIDIA: Dividends and Shareholder Returns
As of June 30th, 2023, NVIDIA’s dividends per share stood at $0.04.
While NVIDIA has been distributing dividends to its shareholders, AMD has yet to begin any such payouts as of now.
The table below displays NVIDIA’s Ex-dividend/Effective Date and the corresponding dividend amount received by its shareholders.
| Ex/EFF DATE1 | Cash Amount1 |
| 6/7/2023 | $0.04 |
| 3/7/2023 | $0.04 |
| 11/30/2022 | $0.04 |
| 9/7/2022 | $0.04 |
| 6/8/2022 | $0.04 |
| 3/2/2022 | $0.04 |
| 12/1/2021 | $0.04 |
| 8/31/2021 | $0.04 |
| 6/9/2021 | $0.16 |
| 3/9/2021 | $0.16 |
NVIDIA has been regularly rewarding its shareholders with dividends. While the company maintained a consistent dividend of $0.04 per share for most of the observed period, there was a higher payout of $0.16 per share in the early months of 2021. This could indicate a particularly strong financial performance or a strategic decision by NVIDIA during that time.
Sources: Nasdaq1
Analyst Recommendations
Analysts hold diverse views on the investment potential of AMD and Nvidia. Here’s a breakdown of their recommendations for each stock:
| Recommendation | NVIDIA | AMD |
| Buy1 | 35 | 37 |
| Sell1 | 7 | 1 |
Graphical Anatomy

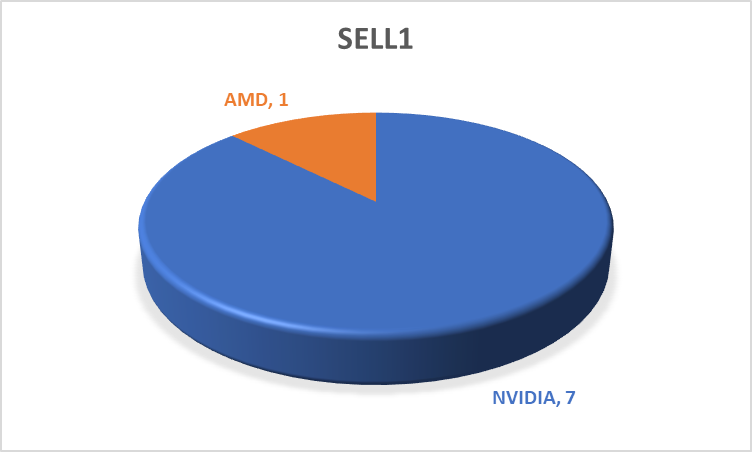
From the given data, analysts rate both companies highly. Yet, AMD has a slight edge with more ‘Buy’ recommendations and fewer ‘Sell’ suggestions than Nvidia. Keep in mind, these recommendations can shift based on market dynamics and the companies’ performances.
Sources: Seeking Alpha1
Conclusion
NVIDIA and AMD are leading GPU manufacturers. However, choosing to invest in AMD or NVIDIA necessitates thorough analysis, considering both companies’ financial health, current market dynamics, and your individual investment goals. Consulting a financial expert can further aid in making an informed decision.
Frequently Asked Questions (FAQs)
The choice between Nvidia and AMD depends on individual preferences and needs. Nvidia is renowned for its potent GPUs favoured by gamers and AI professionals, while AMD offers more cost-effective GPUs that deliver great value.
In Q1 2023, NVIDIA held a commanding 84% market share, while AMD stood at 12%. However, market shares can vary over time due to factors like product launches, pricing, and consumer demand.
People might opt for an AMD GPU over Nvidia for several reasons. AMD GPUs often provide better value due to their affordability. Additionally, AMD’s reputation for budget-friendly CPUs and its GPUs’ open-source drivers make them more compatible with Linux systems.
Although AMD has made notable progress recently, Nvidia’s profitability stems from its dominant market position, renowned brand, and emphasis on premium GPUs for gaming and professionals. Nvidia’s GPUs are highly sought after in gaming and sectors like AI. Furthermore, Nvidia has effectively expanded its offerings beyond GPUs, venturing into data centers and autonomous driving tech.
Failure rates for Nvidia and AMD GPUs can vary based on the specific product and usage conditions. Both companies produce reliable GPUs, but like all electronics, they can face issues like manufacturing defects or overheating. Fortunately, both Nvidia and AMD provide warranties and customer support for their products.