In this guide, you will understand everything you need about technical analysis. This includes its: approaches, basics, how to perform it, why traders use it, and the pros and cons.
Concise Overview
- Technical analysis helps you make informed decisions when you pay attention to its basics
- The two basics of technical analysis are charting and indicators
- With the appropriate use of charts and indicators, they are instrumental in finding short-term and long-term opportunities
- Technical analysis helps identify market trends and know when to take profits or cut losses
- Introduction
- What Is Technical Analysis?
- What Are the Approach to Technical Analysis?
- What Are the Basics of Technical Analysis?
- How Do You Perform Technical Analysis?
- Different Types of Charts In Technical Analysis
- Why Do Traders Use Technical Analysis?
- What Are the Pros and Cons of Technical Analysis?
- Does Technical Analysis Work Well For Better Trading Decisions?
Introduction
Technical analysis is like a language. It’s a way of communicating with the market. The more fluent you are in this language, the better your results.
Also, it’s like reading a book or watching a movie. You can’t just skim through it and expect to get everything out of it. You need to pay attention, do your homework, and go over the material multiple times before it makes sense.
As a trader, you want to make informed decisions. This includes knowing how to use charts and indicators and understanding the basics of market fundamentals. There are a lot of things technical analysis can help you get a better grasp of the market, and it’s something that every trader should learn how to do.
This guide covers a lot of technical analysis. On this note, the following areas will be covered: what technical analysis is, its approaches, the basics of technical analysis, chart types used in technical analysis, why you need it, why traders use it, the pros and cons of technical analysis, and how well it works for better trading decisions.
What Is Technical Analysis?
Technical analysis uses charts and indicators to predict future price movements based on the past performance of a given asset, such as stocks and securities. It’s a way for traders to try to gain an edge over other market participants by identifying patterns in the price data and acting on them. Technical analysis isn’t just about making predictions; it also helps you understand why those predictions are being made.
Call it a map; technical analysis is your guide to trading. If you don’t know how to read a technical analysis chart, you will have a hard time making money in the stock market. But with the proper knowledge, you can turn this chart into an invaluable tool for finding short-term and long-term opportunities. You can also use technical analysis for currencies, commodities, stocks, or any other financial instrument with price history.
What Are the Approach to Technical Analysis?
There are two approaches to technical analysis: top-down and bottom-up.
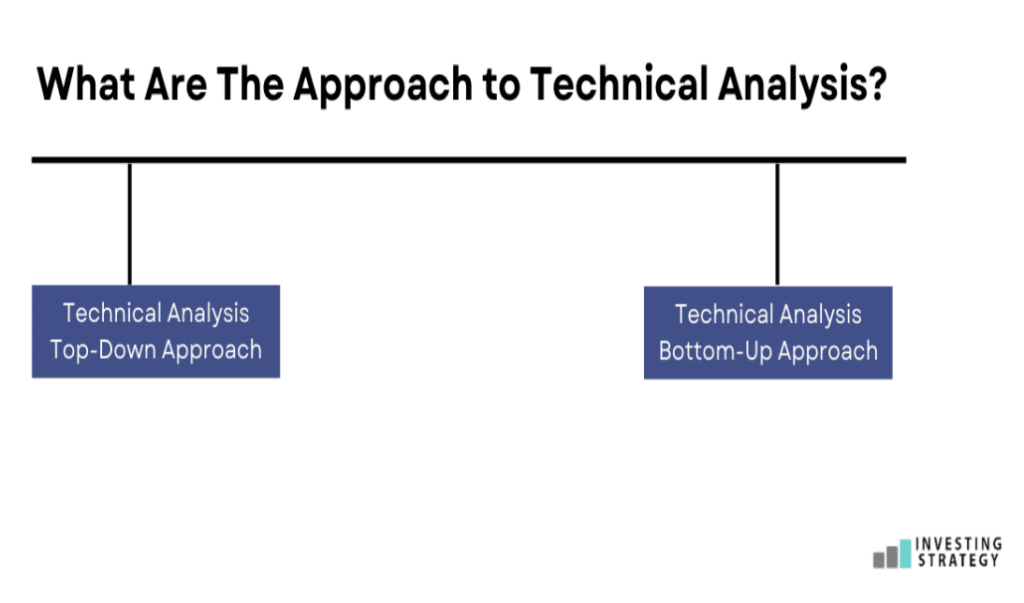
Technical Analysis Top-Down Approach:
A top-down approach looks at the big picture before getting into the details. It starts with the market and then focuses on specific sectors or industries. Top-down analysis is often used to predict what will happen next in an industry or sector based on historical data, economic reports, and other external factors that influence it.
Technical Analysis Bottom-Up Approach:
On the other hand, a bottom-up approach focuses on individual stocks rather than looking at trends in a broader market. This can help traders spot opportunities for making money by identifying undervalued companies and trading them accordingly. This method focuses on price patterns like support and resistance levels, trend lines, and channels.
These approaches help you know what’s going on in the market, the implications for your investments, and how you can turn the information into actionable trade ideas.
What Are the Basics of Technical Analysis?
Technical analysis is a way to analyse the market and make predictions based on historical information. It helps you determine if an asset is undervalued or overpriced. The basics of technical analysis include:
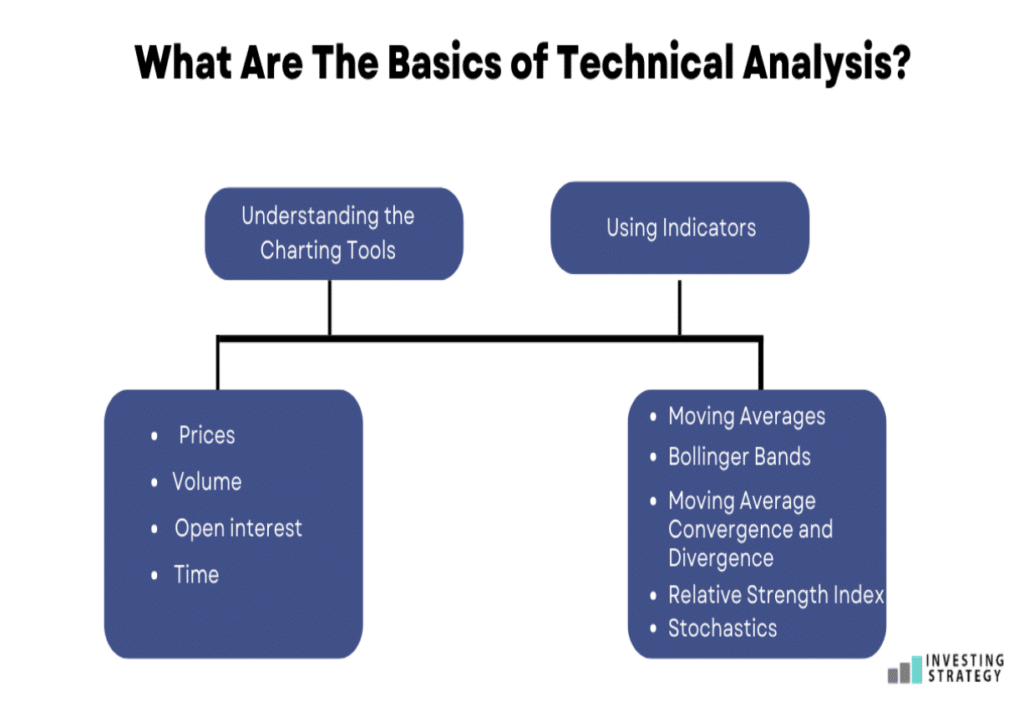
Understanding the Charting Tools
Technical analysts use charts to study price movements over time and make predictions. There are many different charts, but they all have the same essential elements: price, volume, open interest, and time.
- Prices are the most critical factor in technical analysis since they’re what you’re trying to predict.
- Volume refers to the number of shares that trade hands on any given day and can help determine if a trend is strong or fading.
- Open interest is the total number of contracts traded over time.
- Time provides context for price movements.
Using Indicators
Indicators help technical analysts read the market and identify trends. They’re based on mathematical formulas applied to price movements over time. Indicators can confirm or contradict a trader’s hypothesis about what will happen next in the market. The most commonly used technical indicators are moving averages, Bollinger Bands, MACD, RSI (Relative Strength Index), and stochastics.
- Moving Averages: A moving average is a trend-following indicator that uses historical data to smooth out short-term fluctuations and identify long-term price trends.
- Bollinger Bands: Bollinger Bands measure volatility by comparing prices to the standard deviation from recent highs and lows.
- Moving Average Convergence and Divergence: MACD is a trend-following indicator that uses the difference between two moving averages to identify trends in price.
- Relative Strength Index: The Relative Strength Index (RSI) measures momentum by comparing recent gains and losses to establish overbought and oversold conditions.
- Stochastics: A combined oscillator that uses closing prices and the high, low, open, and close of each period as inputs to determine if a trend exists.
How Do You Perform Technical Analysis?
To perform technical analysis, you need combinations of charting and indicators to help you make better trading decisions. These include:
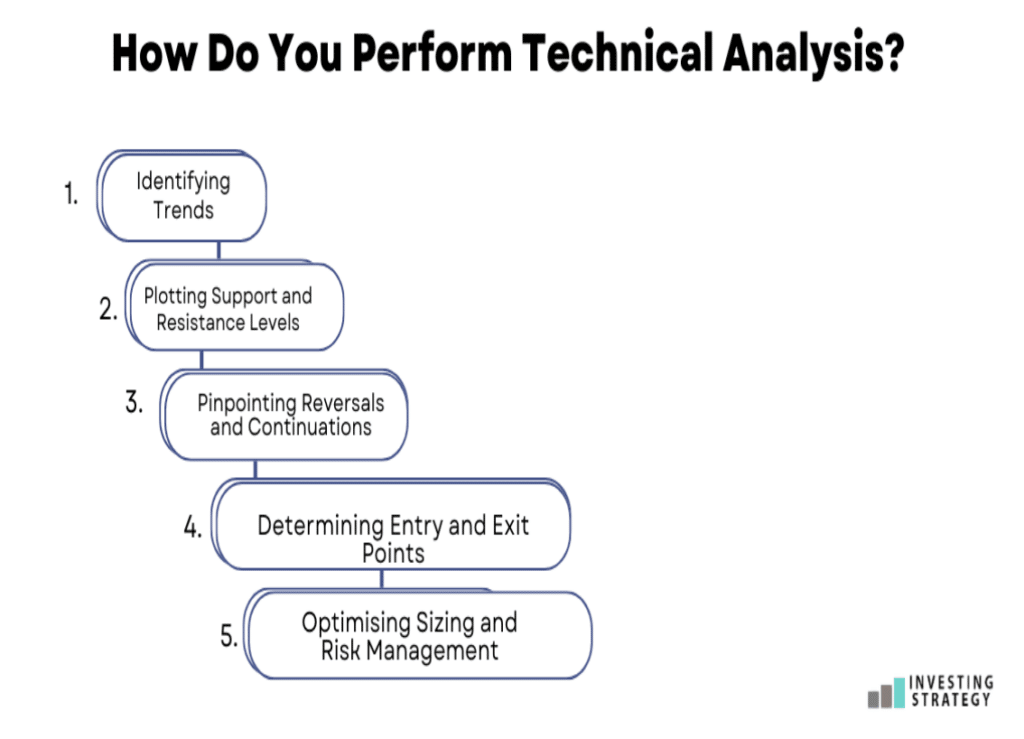
- Identifying Trends
Trends are the price movements that occur over time in a particular asset. There are three types of trends:
Uptrends (also known as bull markets) are when prices move upward over time.
Downtrends (also known as bear markets) are when prices move downward over time.
Sideways trends (or ranging markets) occur when the price of an asset moves sideways or in a small range for an extended period.
To perform technical analysis, you need to know how to identify trends. A trend is a series of prices that move in the same direction over time. For example, if the price of an asset moves up for several days in a row, this is considered an uptrend. If it then moves down for a few days, that’s a downtrend. If an asset has been trading sideways for several months and then breaks out of this range with a sustained move higher or lower, that could be considered a trend. A trend can be either long-term or short-term.
- Plotting Support and Resistance Levels
A support level is a price at which an asset tends to find buyers. Support levels are where buyers step in, preventing prices from falling further. Resistance levels are the opposite of support levels. They represent points where sellers take control and prevent prices from rising any higher. These two areas often correspond to specific price points or chart patterns traders have identified over time.
- Pinpointing Reversals and Continuations
A reversal is a change in the underlying trend of an asset. A continuation is a move in the same direction as the prevailing trend. A reversal can be identified on a chart by looking for either a resistance level or support level broken through by prices (i.e., where prices have penetrated through old support levels).
When this occurs, it is often followed by a quick price spike in the opposite direction. This price spike can lead to another reversal if it fails to hold above or below these levels.
- Determining Entry and Exit Points
When trading a reversal or continuation, knowing where to enter and exit the trade is essential. The best way to do this is by using support and resistance levels on your technical analysis chart. As mentioned above, these are areas where previous price action has created a level of support or resistance for prices. If a level has been tested multiple times without breaking through, it will be more likely to hold when future price action attempts to penetrate that level again.
- Optimising Sizing and Risk Management
After you’ve found your entry and exit points, it’s important to size your trade. This is the currency you will trade on each side of the market. The best way to do this is by using a stop-loss order or trailing stop-order. This will give you the ability to manage risk while still being able to take advantage of potential price movements.
Different Types of Charts In Technical Analysis
Technical analysis is based on historical data. This means it uses past prices to predict future trends and movements in the market. The analysis can be done using a variety of different types of charts, including:
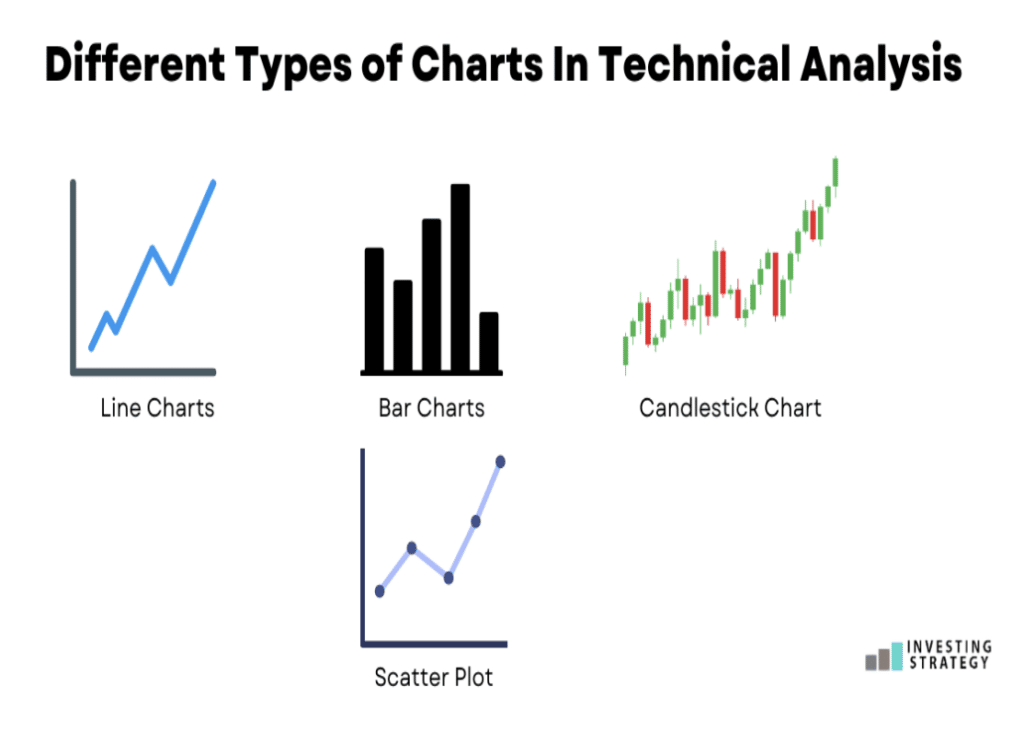
- Line Charts
A line chart is a simple graph of the closing price for each day. The data points are connected by a line that shows the trend over time. Line charts can be used to identify support and resistance levels and confirm trends.
For example, if the line chart shows a series of lower highs and lower lows, the price is likely trending down.
- Bar Chart
A bar chart is a visual representation of the price movement over time. It shows each day’s trading session open, high, low, and close. The height of each bar reflects the price movement for that day. An everyday use for bar charts is identifying trendlines, which are straight lines used to forecast future price movements based on past performance.
For example, if the price is in a downtrend and the bar chart shows lower highs and lower lows, it may be a good idea to sell.
- Candlestick Chart
A candlestick chart uses a candle-shaped graph to represent the price movement over time. It is a popular form of charting that provides a visual representation of trading activity during any given period. Technical traders and investors commonly use candlestick charts because they provide more information than standard line or bar charts. In addition to showing open, high, low, and close prices for each day’s trading session, candlestick charts include additional indicators that can be used to make trading decisions.
- Scatter Plot
Scatter plots show the relationship between two variables. If there is a relationship, it might be linear (straight line) or curvilinear (curved line). The x-axis represents one variable, while the y-axis represents another.
Points are plotted according to their position on each axis; these points form a scatter plot which can then be analysed for patterns and trends. The strength and direction of the relationship may also be determined by looking at the scatter plot.
Why Do Traders Use Technical Analysis?
Traders often use technical analysis to make trading decisions. These are:
- To predict market direction
- To plot support and resistance levels
- To anticipate reversals and measure overall market sentiment
- To determine whether or not to enter the market
- To optimise sizing and risk management
- To determine the strength of a currency pair or an individual asset
Technical analysis is not a magic bullet, however. It can only help you identify potential trade setups and opportunities, which is why many traders prefer it over other forms of analysis.
What Are the Pros and Cons of Technical Analysis?
The pros of technical analysis are numerous, but there are also some drawbacks.
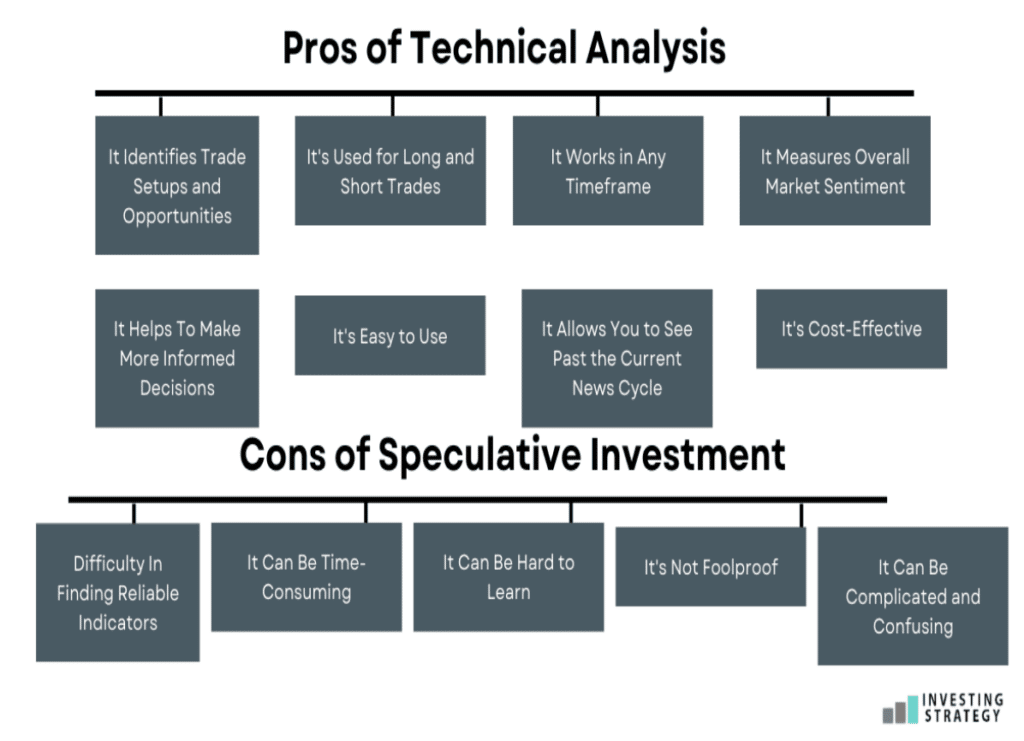
The Pros
The main advantages are:
- It Identifies Trade Setups And Opportunities
It allows you to see what’s happening in the market right now and how it will likely play out in the future. This can help you make better decisions and avoid unnecessary losses.
- It’s Used for Long and Short Trades
It can identify long and short trade setups, which is a huge advantage for traders. Many investors only use technical analysis for short-term trades, but it also has applications in the long-term market.
- It Works in Any Timeframe
Technical analysis is not limited to any one-time frame. It can be used on a daily, weekly, or monthly basis. The only thing that matters is having enough data points to make the analysis accurate.
- It Measures Overall Market Sentiment
Technical analysis is not limited to any one market or asset class. It can be used on stocks, currencies, commodities, and bonds. It’s a great way to measure overall market sentiment and identify potential opportunities or threats.
- It Helps to Make More Informed Decisions
Since the markets are constantly changing and evolving, this is extremely important. Without technical analysis, traders would have to rely on their gut feelings alone—and those can often lead us astray.
- It Allows You to See Past the Current News Cycle
Technical analysis can help traders see past the current news cycle. This is because it gives them insight into what’s driving prices rather than just focusing on what’s happening right now.
- It’s Easy to Use
Technical analysis is not complicated. It’s easy to use—even for beginner traders with little or no market experience. You don’t need to be an expert to benefit from technical analysis.
- It’s Cost-Effective
Technical analysis is an effective investment strategy that doesn’t require large amounts of capital. All you need to start using it is a computer with internet access and a trading platform to begin your journey into the world of technical analysis.
The Cons
There are a few drawbacks to using technical analysis as an investing tool. These include:
- Difficulty in Finding Reliable Indicators
For a starter, finding a reliable set of indicators may be challenging. You need to search for hours, if not days, until you find the right ones to help you make accurate investment decisions. The indicators themselves can be challenging to use, especially if you’re just starting. Reading them correctly takes a lot of practice and making the right trading decisions based on what they say.
- It Can Be Time-Consuming
It’s essential to ensure that you have the time to dedicate to technical analysis before adopting it as a strategy. It takes time to learn how to read indicators, interpret them correctly and make the right trading decisions based on what they say.
- It Can Be Hard to Learn
Technical analysis takes work to learn. It takes time, effort, and practice to master the art of technical analysis. It would help if you spent countless hours studying price patterns, candlestick formations, and indicators before you can begin trading confidently.
- It Can Be Complicated and Confusing
Even though it’s easy to use, learning the ropes of technical analysis takes time and effort. The learning curve can be steep, and it can be challenging to keep track of all the different indicators, signals, and patterns. If you don’t have a good trading mentor, you may make costly mistakes that could set your profits back for months or even years.
- It’s Not Foolproof
Technical analysis won’t work all the time—that’s one of its most significant flaws. While it does have a great track record for predicting market activity over time, there are times when TA fails to provide any helpful information about what happens next, especially taking the present state of the market into account.
Does Technical Analysis Work Well For Better Trading Decisions?
The answer is yes; technical analysis works well for better trading decisions. Although, there are times when the market moves unpredictably, and technical analysis cannot accurately predict future price movements. However, if you can identify when this occurs and adjust your trading strategies accordingly, in that case, you can avoid making costly mistakes that could set back your profits for months or even years.
Furthermore, it’s also important to remember that technical analysis is only one component of the overall process of trading. It works best when it is used with other indicators, like fundamental analysis (FA) – which provides information about a company’s financial health and performance using economic factors such as interest rates and inflation rates.
The fact about TA is that even investors that don’t use it as their primary method of forecasting price movements make use of it as a helpful tool and additional input into their decision-making process. This is because one of TA’s most important uses is identifying market trends and knowing when it’s time to take profits or cut losses.