
Ever gazed at a stock chart and felt like you’re deciphering ancient hieroglyphs? We’ve all been there in the beginning. This guide is for you as well as traders who already have basic knowledge about charting. By the end of this article, those cryptic lines and bars will transform into a treasure map, that could guide your trading decisions.
- Why Charting Tools?
Think of charting tools as your trusty compass in the vast ocean of stock trading. They don’t just display data; they give you signals of the movements of stocks, based on their highs, their lows, and everything in between. - The Digital Evolution
Gone are the days of paper charts and tedious manual calculations. Welcome to the digital age, where stock trading apps give you whole new opportunities. They’re efficient and they’re packed with features designed just for you.
How can Charting Tools Help?
Why should you bother to learn and care about charting tools?
- You can view the Market’s Pulse
Charts are more than pretty visuals. They’re like the heartbeat of the financial market. And for you to be in sync with the market’s rhythm, you need to master these tools. - You can enhance Your Decision-making
Ever felt overwhelmed by the sheer volume of stock data? Charting tools break it down for you, making it digestible and actionable. They give you the ability to spot trends, with a high probability to predict movements and based on that make informed decisions. - The Power of Technical Analysis
By analyzing past market data, you can look at potential future movements. It’s a bit like having a crystal ball.
Types of Charts
Navigating the stock market without understanding the types of charts is like sailing without a compass. Let’s look at the most popular chart types, so you can pick your favorite tool for your future trading.
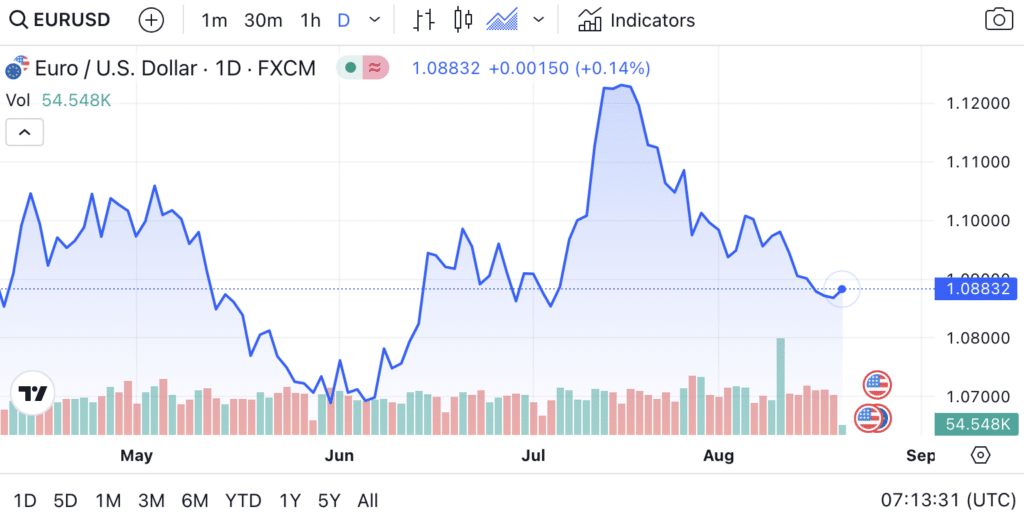
Line Charts
| Aspect | Description |
|---|---|
| Definition | Represents closing prices over a specific period. |
| Benefits | Simplicity makes it easy for beginners. Perfect for getting your feet wet! |
| Limitations | Lacks detailed info like open, high, or low prices. But hey, sometimes less is more! |
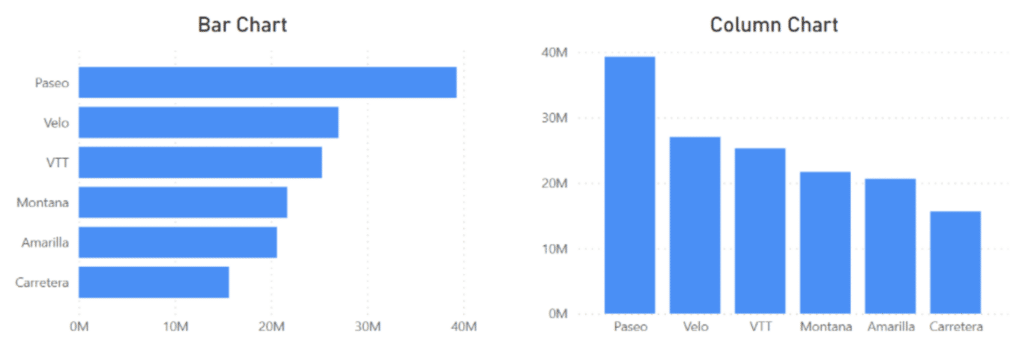
Bar and Column Charts
| Aspect | Description |
|---|---|
| Definition | Uses vertical bars to showcase the price range for a given period. |
| Components | Top of the bar? That’s the highest price. Bottom? The lowest. And those ticks on the sides? Opening and closing prices. |
| Benefits | Offers a more detailed view than line charts. It’s like upgrading from regular to HD! |
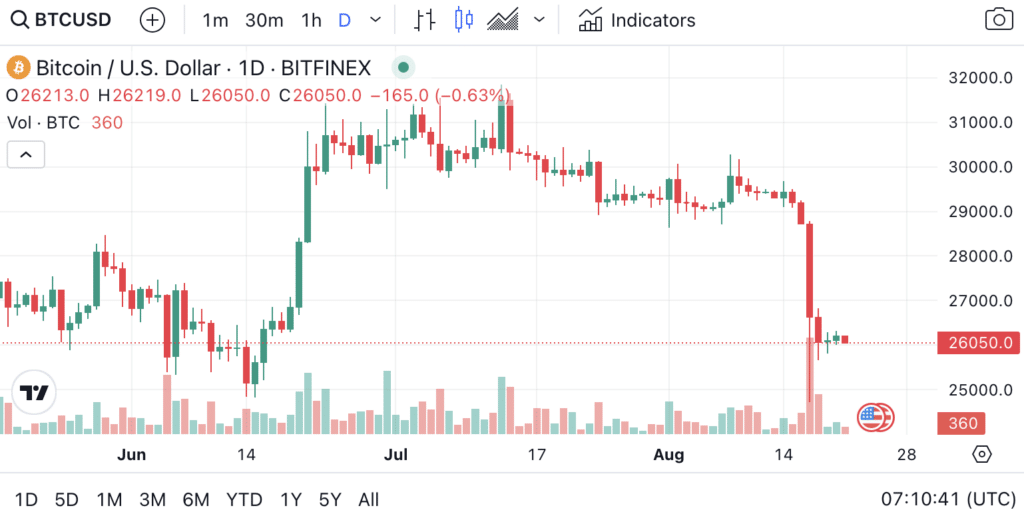
Candlestick Charts
| Aspect | Description |
|---|---|
| Origin | An import from Japan and a favorite in technical analysis. |
| Components | The body shows the difference between open and close prices. Wicks? They’re the highest and lowest prices. |
| Patterns | Ever heard of Doji, Hammer, or Engulfing? These patterns are like the secret codes of the stock world, predicting market movements. |
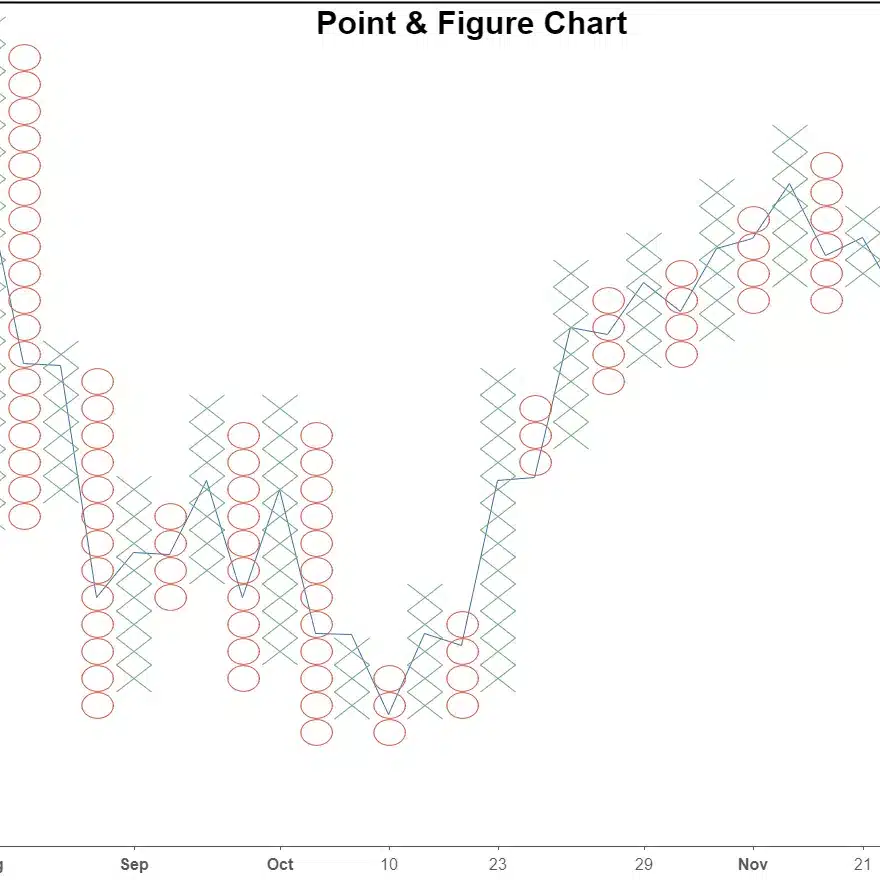
Point & Figure Charts
| Aspect | Description |
|---|---|
| Definition | All about price changes, giving time a backseat. |
| Benefits | Say goodbye to minor price fluctuations and hello to clear trends! |
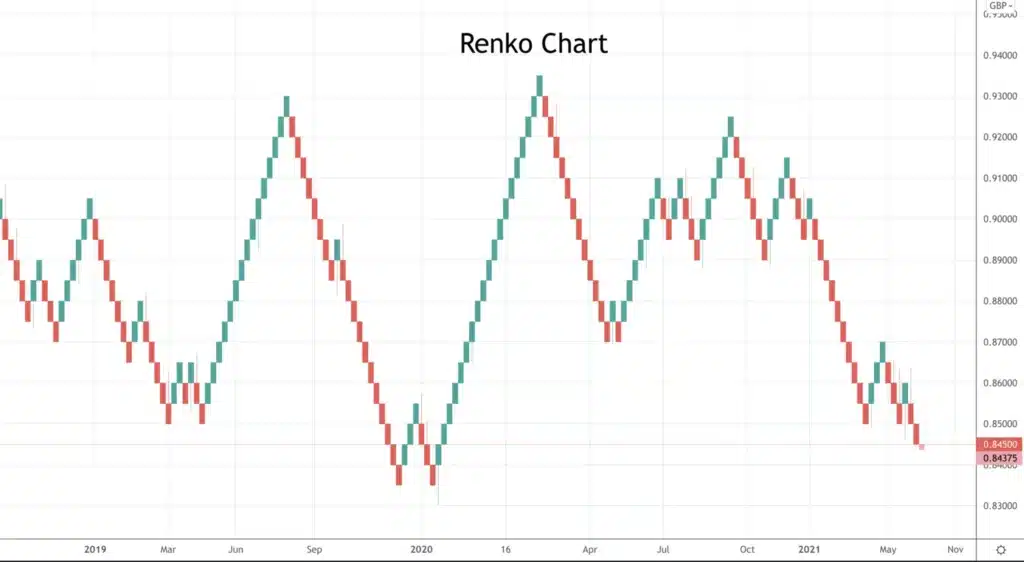
Renko Charts
Inspired by the Japanese term ‘Renga’, which means brick.
| Aspect | Description |
|---|---|
| Features | Uses bricks of a fixed price movement, filtering out those pesky minor price changes. |
| Benefits | A superstar when it comes to identifying support and resistance levels. |
Key Features of Charting Tools
Charting tools are packed with features, they’re designed to give you an edge in the market. But with so many tools at your disposal, where should you start? Let’s break it down for you.
Timeframes
Ever heard the saying, “Timing is everything”? In trading, that’s actually true.
| Aspect | Description |
|---|---|
| Importance | Different strokes for different folks! Your trading strategy dictates your timeframe. |
| Types | From the rapid pace of Intraday (minutes to hours) to the broader view of Monthly charts. |
Indicators
The indicators are your guides, helping you navigate the world of stock trading.
- MACD (Moving Average Convergence Divergence): Think of it as a dynamic duo of moving averages, showcasing their intricate dance.
- RSI (Relative Strength Index): Feeling the market’s pulse, it tells you if a stock is feeling under the weather (oversold) or partying too hard (overbought).
- Bollinger Bands: Imagine a road. The middle band is the road, and the outer bands? They’re the sidewalks, keeping prices in check.
- Stochastic Oscillator: It’s all about perspective. By comparing a closing price to its recent range, it offers a fresh viewpoint.
Drawing Tools
Your canvas is the chart, and these are your brushes.
- Trendlines: Like a storyteller, it narrates the stock’s journey.
- Support and Resistance: The Support and the Resistance are the heroes of our story. These levels are where prices take a stand, either soaring to new heights or taking a breather.
- Channels: Picture two parallel trendlines, guiding the stock price like protective guardians.
Customizability
Because your chart should be as unique as you are!
- Themes: Whether you’re a night owl who loves Dark Mode or a daydreamer who prefers Light Mode, there’s something for everyone.
- Gridlines: Adjust to your heart’s content, ensuring every detail stands out.
- Zoom: Dive deep into specific timeframes or take a step back for a broader view. The choice is yours!
Advanced Charting Techniques
Ready for more? Advanced charting techniques are like the secret spices of the trading world. They add flavor and precision to your trading decisions. Let’s unravel these mysteries together.
Fibonacci Retracement
Based on mathematics, let’s look at the Fibonacci retracement.
| Aspect | Description |
|---|---|
| Origin | Inspired by the Fibonacci sequence, a series where each number is the sum of the two preceding ones. |
| Use | It’s like a crystal ball, helping you spot potential support and resistance levels. An extremely useful tool in your trading arsenal. |
Elliott Wave Theory
Ride the waves of the stock market!
| Aspect | Description |
|---|---|
| Definition | A theory that predicts market trends by tapping into crowd psychology. It’s like reading the market’s mind! |
| Components | Picture the sea with its waves. Five waves push forward with the trend, while three corrective waves pull back. It’s the rhythm of the market. |
Harmonic Patterns
Dance to the tunes of the Fibonacci numbers!
| Aspect | Description |
|---|---|
| Definition | These patterns use the power of Fibonacci numbers to try to predict the future of stock movements. |
| Types | From the graceful Bat to the intricate Gartley, the transformative Butterfly, and the robust Crab—each pattern will tell a unique story. |
| Application | They’re like signposts, guiding you to potential reversal points in the market. So, keep your eyes on these! |
Comparing Popular Stock Trading Apps
Not all stock trading apps are created equal. Dive deep into their charting capabilities to find your ideal companion. However, charting tools are not the only factor to consider when choosing your stock trading app. Think about usability, an app that’s intuitive and user-friendly can be a game-changer. Features and asset selection will also be important. Every app has its strengths and weaknesses. Weigh them carefully to make an informed choice. Here you can see the best stock trading app in the UK.
Charting and Fundamental Analysis
Charts don’t tell the whole story. You need to add fundamental analysis to your approach.
- Holistic Approach: While charts give you the “what”, fundamental analysis provides the “why”. Combine them for a 360° view.
- Key Metrics: Analyze earnings reports, P/E ratios, and company news. These pieces of information can be the difference between a good or a bad trade.
- Balancing Act: Like yin and yang, charting tools and fundamental analysis complete each other. Use both for a well-rounded trading strategy.
Common Mistakes to Avoid
Nobody’s perfect, but hey, let’s try to get close!
- Over-reliance on a Single Indicator: Don’t put all your eggs in one basket. Look at several indicators and see if they all point you in the same direction.
- Ignoring Broader Market Trends: Don’t get so lost in the details that you miss the bigger picture.
- Chasing Losses: Sometimes, it’s best to step back, reassess, and live to trade another day.
Conclusion
Charting tools in stock trading apps are more than just features; they’re your allies. Learn how to use them, use your knowledge, stay curious, and always trade with integrity. Here’s to your success!
Read about investing in stocks and shares in the UK.
Interested in other features of stock trading apps? Read our extensive guide on features here.