When you’re obtaining VIX, how do you calculate it? What Options are included in calculating the VIX? How do you trade the VIX? The components and factors affecting its components? Everything you need to know about the VIX is discussed here.
Concise Overview
- The VIX is an index that measures the volatility of the equity market
- You must know the current level of the VIX based on the prices of S&P 500 options to determine the market’s volatility
- You must also understand the effect of changes in the VIX on options prices
- You can find the VIX on most financial news sites, such as CBOE, Yahoo Finance, and Google Finance, to get an idea of the market’s volatility at any given time
The VIX is a popular market volatility measure used for trading options. It’s often referred to as the ‘fear gauge’ because it measures how much investors expect the price of the S&P 500 index to fluctuate over the next 30 days.
VIX is an excellent tool for investors who want to hedge their portfolios or trade options. In this piece, you’ll learn the need for VIX, how it’s calculated, how it’s used in options trading, the components of this indicator, and what factors impact the indicator. You’ll also understand how volatile the market is, and how investors can use this information to their advantage.
What Is the VIX?
The VIX is an indicator calculated by the Chicago Board Options Exchange (CBOE) that measures the market’s expectation of future volatility. It was created by Professor Robert E. Whaley and introduced in 1993 by CNBC, a television network focused on business news and stock market coverage.
The measure is a forward-looking indicator, reflecting expectations of future price swings rather than current prices. It helps investors determine whether it’s a good time to buy options or futures contracts because it shows how much investors are willing to pay for protection from losses.
This value also indicates if there is more room for prices to rise or fall and provides insight into how much volatility investors expect in the near future. Since it was first introduced in 1993, it has become one of the most popular ways to measure investor sentiment and predict future stock market movements.
How to Calculate Volatility Index (VIX)
The VIX is calculated using the average price of a basket of options on the S&P 500. The measurement extends to using the prices for calls and puts with various strike prices, expirations, and months until expiration. It uses several weighted averages to calculate its value, including current index option premiums for each strike price and their respective implied volatilities. This means that investors can get an idea of the level of fear in markets by looking at how expensive or cheap these contracts are compared to what they were in the past.
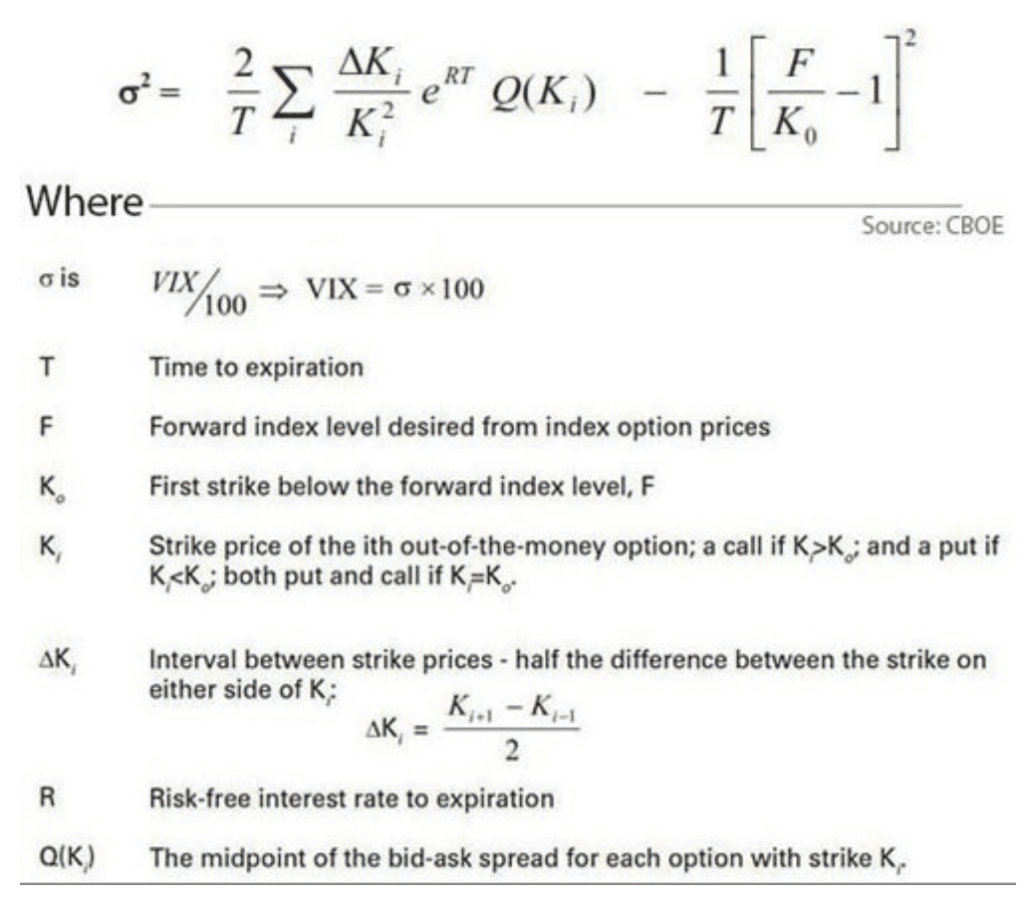
In mathematical representation, the formula for VIX is:
What Options Are Included in Calculating VIX?
When calculating VIX, CBOE will use the following:
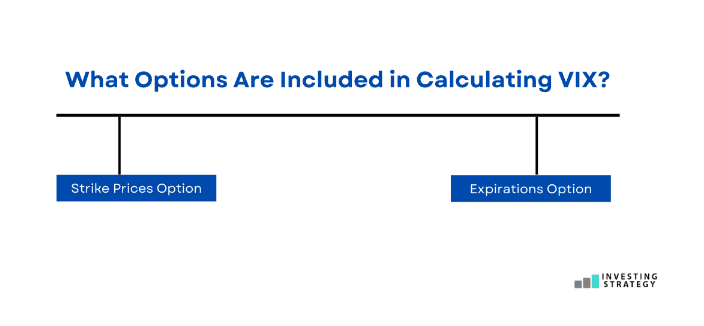
- Strike Prices Option
For each strike price, the calculation of VIX considers the price of options (both calls and puts) with different expiration dates and strike prices. This means that investors can look at the VIX number to see how volatile the market is.
- Expirations Option
The VIX also considers the expiration date of the options being traded. For example, if more put options are expiring in one month than in two months, investors will think that the market is fearful of something happening within that period.
Expirations options are categorised into two: “near term” or “next term.” The next term is another way of saying “the next month.” The near term is broader in that it could be anywhere from two weeks to one month. The VIX considers both these categories when calculating the market’s current volatility.
How To Trade The VIX
Before you can decide on trading the VIX, you need to know the following:
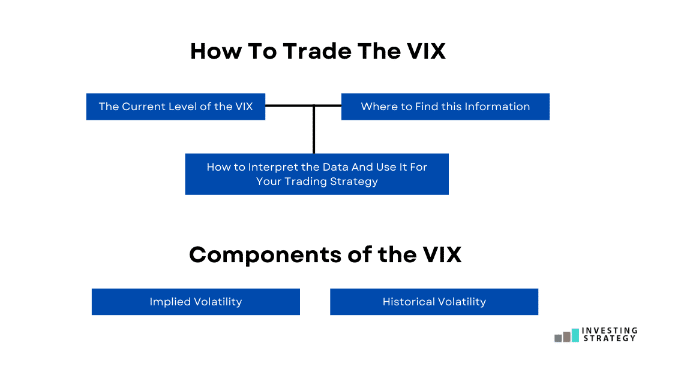
- The Current Level of the VIX
The VIX is calculated based on the prices of S&P 500 options. This means you need to consider which direction the market is going, how volatile it has been, and how long until it expires.
Trading the VIX is similar to trading any other index. You need to know how it’s performing currently and identify the trend created by the current level of volatility. The VIX takes into account the past 30 days of market activity. So to know what the current level of volatility is, then you need to look at the current VIX CBOE.
As of April 2022, the VIX sat at a reading of 18.30, indicating that the market was behaving normally, and investors saw average stock volatility over the next 30 days.
If you’re trading VIX options, you want to pay attention to these levels because they can help determine which trading strategy will work best for your portfolio. The market’s overall trend also significantly determines how volatile it is and how long it takes until expiration.
- How to Interpret the Data And Use It For Your Trading Strategy
The VIX is an excellent tool for traders to use, as it helps them to determine how much volatility they can expect from the market. Traders can use this data to make their own trading decisions and limit the risk they want to take in any trade.
For example, if you are trading stock options and see that the VIX reading has risen above 20, consider taking some profits off the table before things worsen. The higher the VIX reading, the more volatile investors expect stocks to be over the next 30 days.
The guide below will help you make an informed decision on the market’s volatility within the next 30 days.
- VIX of 0-12: When the VIX is at this level, volatility will probably be low.
- VIX of 13-19: It’s considered normal for the VIX to be at this level, and volatility over the next 30 days would also be expected to remain normal.
- VIX of 20 or higher: When volatility gets above 20, you can expect market stress like that caused by concerns about an economic slowdown or recession.
You can also use this guide to determine the right time to cash out your options and how much you can expect to make from the sale.
- Where to Find this Information
You need to know where to find this information so you can use it to make better trading decisions. The best place to go is the CBOE website, which has a page dedicated to volatility statistics. There, you’ll see a breakdown of how much the VIX has moved up or down over the past year, month, and week as well as other key data points like how many options were traded on that day. For example, if you’re looking at a particular date, you’ll see the amount of options contracts traded on the day, and you can compare the changes to the current date.
In addition, you can also find VIX data on Yahoo Finance or Google Finance. The VIX is typically updated slightly every minute during market hours, and you can quickly assess it by entering ‘VIX’ in the provided search box. You can get your hands on a VIX chart and see how it moves over time, which will tell you whether volatility is currently high or low by looking at the current level of the S & P 500.
Components of the VIX
The VIX is made up of two main components:
- Implied Volatility
This is the market’s expectation of how much a security will move. Implied volatility is very similar to the concept of “implied interest rates” in other markets, such as foreign exchange or fixed income; it’s the price you get when you use an option pricing model to value options contracts.
- Historical Volatility
Historical volatility is the actual movement of a security’s price over time. This can be measured by looking at a stock chart or using an average of previous data points.
Factors Impacting the Components of the VIX
Many factors influence the components of the VIX. These include:
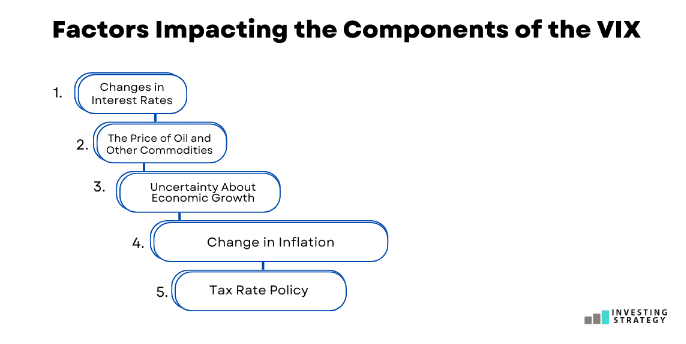
- Changes in Interest Rates
Increases in interest rates will cause a decrease in the value of stocks, as investors will be willing to take on less risk. When this happens, volatility tends to increase. This is because the perception of increased risk leads investors to demand higher returns for holding securities and other investments.
- The Price of Oil and Other Commodities
The price of oil and other commodities strongly relates to stock volatility. When there is an increase in the price of these commodities, investors tend to expect higher inflation rates and are more likely to perceive this as a threat to their portfolios. As a result, they will sell off stocks for safer investments such as bonds or cash. This can cause volatility levels to rise across all market indexes.
- Uncertainty About Economic Growth
The uncertainty surrounding economic growth can also lead to increased stock market volatility. When investors are uncertain whether the economy will expand or contract, they tend to become more conservative with their investments. They may sell off stocks for safer investments such as bonds or cash to protect themselves from a potential downturn. This can cause volatility levels to rise across all indexes.
- Change in Inflation
The change in inflation can also lead to higher stock market volatility. When investors see inflation rise, they become concerned about their investments losing value over time. This can cause the stock market to become more volatile. Investors will decide to sell off stocks with high inflation exposure to protect themselves from further losses. This also causes volatility levels to rise across all indexes.
- Tax Rate Policy
Tax rate policy changes can also lead to higher stock market volatility. When investors see that tax rates are going up on their investments, they become concerned about their long-term returns. This can cause the stock market to become more volatile as investors lose confidence in future earnings growth potential and start selling off stocks to cut their losses.
Can Investors Invest in VIX?
The VIX is a benchmark that measures investors’ expectations for future stock market volatility. Investors cannot purchase it directly but can invest in various VIX-related products. These include:
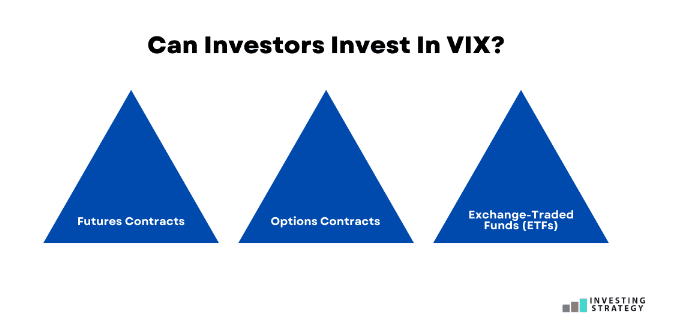
- Futures Contracts that allow investors to bet on changes in the index
- Options Contracts that give them the right but not the obligation to buy or sell stocks at a set price at any time before expiration
- Exchange-Traded Funds (ETFs) that hold the VIX, such as; the iPath S&P 500 VIX Short Term Futures ETN (VXX), the ProShares Ultra VIX Short Term Futures ETF (UVXY), and the VelocityShares Daily Inverse VIX Long ETN (XIV)
Investors use the VIX to predict stock market volatility, which has become a significant part of many trading strategies. Traders must understand how these products work because they’re directly affected by the VIX Index.
For those who want to trade any of the products mentioned above, it’s essential to understand that they can be used as long-term investments or short-term trading instruments. For instance, if you’re investing in ETFs, it would be the best investment for the short term. This is because the VIX Short-Term Futures ETF (UVXY) is designed for those looking for short-term gains with daily rebalancing. The market is highly volatile, and it’s easy to lose money when uncertainty hits the market when investment is in the long term.
What Are the Benefits of the VIX?
The VIX Index has many benefits. Here are some of them:
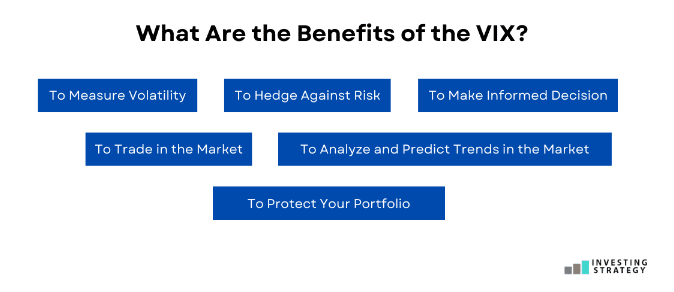
- To Measure Volatility
The VIX is an excellent tool for investors and traders to measure volatility. It’s useful for financial analysts and portfolio managers, as it allows them to predict market movements based on the changes in the price of their stocks. The VIX is also used by traders who want to profit from market volatility using options trades. The index helps them determine which options are more valuable at any given time.
- To Hedge Against Risk
The VIX is also used as a hedge against risk for traders who want to ensure that their portfolios won’t lose money when volatility rises. It does this by indicating how much the market will move over the next 30 days based on current prices. This can help you determine whether or not it’s better to sell your stocks, wait and see if they drop in value, or hold onto them until things settle down again.
- To Make Informed Decision
The VIX is also used by traders who want to make informed decisions about which stocks to buy and sell. When the VIX rises, this indicates that there’s more risk in the market—which means you may want to hold off on buying new stocks or selling your existing ones until things calm down again. If the VIX drops, however, it means that investors feel more confident about investing their money in stocks—so this might be a good time for you to purchase some shares.
- To Trade in the Market
One of the most common uses of the VIX is by traders who want to trade in the market. This is done through an exchange-traded fund (ETF) or a futures contract, which are easy ways to get into this kind of investment without purchasing individual stocks first.
- To Analyze and Predict Trends in the Market
Analysts and forecasters also use the VIX to predict how the market will move. By monitoring this number, they can understand how investors feel about their investments at any given time. If it’s high, it means that people are worried about losing money on their stocks; if it’s low, they seem more confident about making purchases.
- To Protect Your Portfolio
The VIX is also used to protect your portfolio from price fluctuations. If you’re worried that the market will go down, you can buy a derivative contract for protection—this will allow you to sell at a higher price when the market does indeed fall. You’ll have to pay for this protection in interest or other fees, but it might be worth it if it means avoiding losses on your investments.
What Are the Downsides of the VIX?
The VIX is a valuable tool for investors, but there are also some downsides. These include the following:
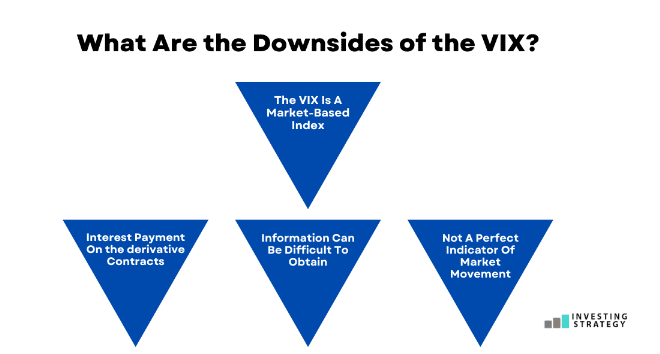
- The VIX Is a Market-Based Index
The VIX is a market-based index. This means it’s based on the options market, which is often volatile and unpredictable. If you’re using the VIX to predict future stock prices, then it might not be effective—after all, there are many other factors at play in the economy and financial markets.
- Interest Payment On the Derivative Contracts
If you hold a derivative contract until it expires, you don’t have to pay interest. In some cases, however, you may be required to pay interest if your position is ‘out of the money’ by the time it expires. This can happen when an option position has lost value and is no longer worth anything because the stock price hasn’t moved as much as expected.
- Information Can Be Difficult to Obtain
It can be challenging for an individual trader to obtain the information needed to decide whether or not to trade options. For example, you may need access to market makers’ trading records and other confidential data to determine what types of contracts are being traded at any given time. This, in itself, can be a difficult task.
- Not a Perfect Indicator of Market Movement
Options could be a better indicator of market movement or investor sentiment. While they may be an excellent tool to use in conjunction with other indicators, they shouldn’t be used as the sole method to predict whether or not an investment will perform well.
Should I Trade Volatility Index (VIX)?
The VIX is a valuable indicator for traders, investors, and others interested in the stock market. It’s used to predict the future direction of a company’s share price or as part of a strategy to protect against losses. It gives you an idea of whether the market is moving up or down and how much volatility there is on any given day. As part of a helpful tool for investors, the VIX isn’t used ordinarily but used in conjunction with other indicators and strategies. In short, it’s a guide that helps you decide how much risk to take in your trades.
This article has been prepared for information purposes only. It does not constitute advice, and no party accepts any liability for either accuracy or for investing decisions made using the information provided.
Further, it is not intended for distribution to, or use by, any person in any country or jurisdiction where such distribution or use would be contrary to local law or regulation.