Company Profile:
Novo Nordisk is a global healthcare company founded in Denmark in 1923. The company’s purpose is to drive change to defeat diabetes and other serious chronic diseases. It has over 49,000 employees worldwide and operates in more than 80 countries. Its headquarters is located in Bagsværd, Denmark.
Novo Nordisk recently surpassed LVMH to become Europe’s most valuable company in terms of market value. With its stock price surging by 40% this year alone, much of this meteoric rise can be attributed to the soaring demand for its groundbreaking weight-loss drugs, Wegovy and Ozempic.
As the company continues to make strides in the healthcare sector, especially weight management, investors and market watchers are keenly observing its trajectory. Here is our equity research to uncover the financial forecasts, stock insights, and the story behind the success of the makers of Wegovy and Ozempic.
Share Price: Novo Nordisk (NVO) Company
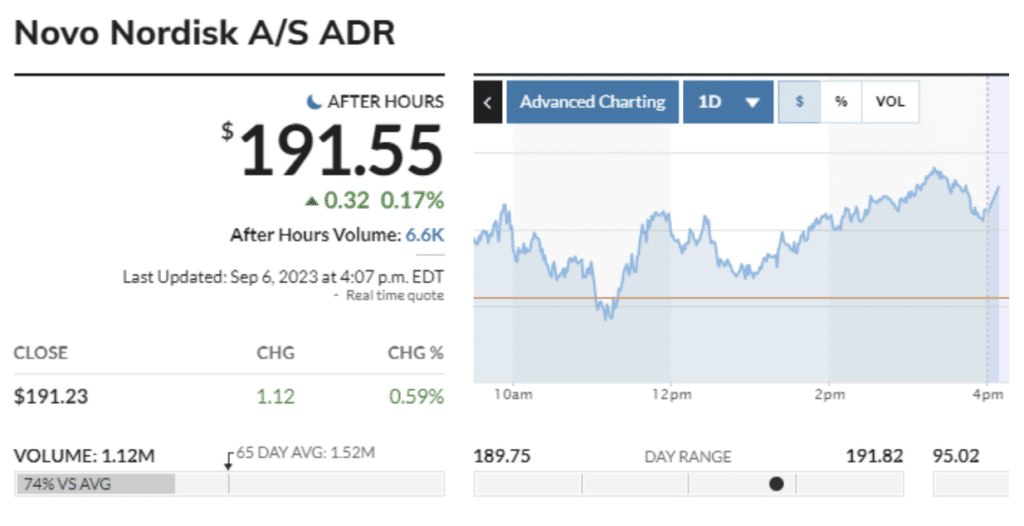
Source: Market Watch, 2023.
Dating back to 19831, the average stock price for Novo Nordisk was 0.3490. In 20221, the average stock price grew to 107.5889. In fact, since its Initial Public Offering (IPO)2, the company has returned +52,344% yield for investors who believe in the company. Conversely, this is more than +3,378% S&P has returned since its IPO.
Novo Nordisk’s (NVO) record of 190.37 USD on August 29th, 20233, was its highest end of day stock price. On the other hand, its lowest stock price record for the end of the day was 0.20 USD on the 19th of October, 19873. In February 20223, Novo Nordisk’s stock price crossed above 100 USD mark.
Source: Macrotrends1, The Motley Fool2, Companies Market Cap3
Financial Performance: Novo Nordisk Company
The annual reports from Novo Nordisk offer an in-depth look at the company’s financial performance and significant events. Below is a look into the last four year financial reports of the company.
| $million | 2019 | 2020 | 2021 | 2022 |
| Revenue1 % Growth2 | 18,290.95 3.71% | 19,448.13 7.92% | 22,401.28 11.61% | 25,056.69 13.81% |
| Gross Profit1 Gross Margin % | 15,279.76 6.07% | 16,241.34 6.29% | 18,637.29 14.76% | 21,028.45 12.82% |
| Operating Profit1 Operating Margin % | 7,867.20 8.90% | 8,292.10 5.40% | 9,330.26 12.52% | 10,592.95 13.53% |
| Net Income1 Net Margin % Earnings Growth3 | 5,838.76 10.57% -3.35% | 6,455.54 10.56% 13.07% | 7,598.14 17.70% 12.47% | 7,862.34 3.48% 5.35% |
| Earnings Per Share ($)1 | 2.46 | 2.76 | 3.30 | 3.46 |
| Cash from Operations5 Cash from Operations Margin % | 7,013 2.80% | 7,959 13.49% | 8,751 9.95% | 11,170 27.65% |
| Capital Expenditures (Capex) Capex Margins % | 1,338.69 -9.03% | 891.42 −33.42% | 1,008.40 13.14% | 1,719.47 70.53% |
| Free Cash Flow6 Free Cash Flow Margin % | 5,674.31 6.05% | 7,067.58 24.55% | 7,742.60 9.55% | 9,450.53 22.06% |
| Return on Assets4 % Return on Equity7 % | 11.17% 8.91% | 17.91% 12.37% | 39.38% 16.02% | 10.39% 5.03% |
All the figures are in Million USD except earnings per share (EPS).
Novo Nordisk’s primary sources of income come from two of the company’s most popular pharmaceutical products. (1) Ozempic, an FDA-approved medication for managing type 2 diabetes, received regulatory clearance in 2017. (2) Wegovy, a weight loss pharmaceutical incorporating the identical active component as Ozempic, gained FDA approval in 2021. Both drugs have experienced significant popularity, contributing to Novo Nordisk’s remarkable earnings of nearly $7 billion in profit during the initial half of 20238.
Novo Nordisk has made remarkable revenues over the course of the last five years. The company has made $7,957.73 million since 2018. The revenues come from the company’s two most purchased products; Wegovy and Ozempic. Wegovy, in 2023, crossed the $1 billion mark in a single quarter, contributing to the company’s sales growth.
When it comes to profitability of the company, it is evident from the above table that the company has been making profits upon profits. While the company keeps stretching its gross profit, there is a downward trend of growth from 2021 14.76% to 12.82% in 2022. Operating profit averaged 9.842% over the course of the last 5 years.
While net income totaled $33,661.00 million between 2018 to 2022, its average of $6,732.20 million in the last five years shows the company’s ability to increase its equity by investing these additional earnings. This average is only bettered by 2021 $7,598.18 million and 2022 $7,862.34 million.
Novo Nordisk’s revenues keep shooting high, as growth is seen to manifest around it. Also, with its earnings per share continuing to increase, experts predict its price to reach $358.65 by 20279. Novo Nordisk generates income from a variety of sources, not just Ozempic and Wegovy. The company also manufactures essential medical devices like insulin pens and injection needles for drug delivery.
Source: Macrotrends1, Companies Market Cap2, Companies Market Cap3, Macrotrends4, Macrotrends5, Macrotrends6, Macrotrends7, CNN Business8, Coin Codex9
Valuations: Novo Nordisk Free Cash Flow
As of September 20231, Novo Nordisk is valued at $422.97 billion, reflecting its promising role in obesity care. Our evaluation employs a two-stage discounted cash flow analysis to forecast free cash flow, revenue, EBITDA, cash flow from operations, and capital expenditures, including growth rate margins. This forecasting takes into account, five year period.
| $million | 2022 | 2023F | 2024F | 2025F |
| Revenue2 Avg. Growth | 25,056.69 8.60% | 27,212.07 8.60% | 29,552.31 8.60% | 32,093.81 8.60% |
| EBITDA2 Avg. EBITDA Margin % | 11,635.41 8.13% | 12,581.60 8.13% | 13,604.73 8.13% | 14,711.06 8.13% |
| Net Income2 Avg. Net Margin % | 7,862.34 6.71% | 8,389.90 6.71% | 8,952.86 6.71% | 9,553.60 6.71% |
| Cash from Operations5 Avg. Cash from Operations Margin % | 11,170 12.6% | 12,577.42 12.6% | 14,162.18 12.6% | 15,946.62 12.6% |
| Capital Expenditures (Capex) Avg. Capex Margins % | 1,719.47 13.69% | 1,954.87 13.69% | 2,222.49 13.69% | 2,526.75 13.69% |
| Free Cash Flow6 Avg. Free Cash Flow Margin % | 9,450.53 14.71% | 10,840.70 14.71% | 12,435.37 14.71% | 14,264.61 14.71% |
The above valuation is carried out for the average period of five years. The average revenue growth for revenue results in a forecasted revenue of $32,093.01 million by 2025. The net income with this five year forecast will amount to $14,711.06 million by 2025. Meanwhile, experts forecast free cash flow to be DKK 98,649 million in 20253, which is DKK 99,312 million (14,264.1 million USD), almost similar to our future valuation in the table above.
Source: Market Watch1, Macrotrends2, Market Screener3,
WACC Computation: Novo Nordisk Projected and Terminal
This section presents information on the Weighted Average Cost of Capital (WACC) calculation for Novo Nordisk A/S, including the current WACC percentage, historical data, and future projections. It also includes the calculation of the Cost of Equity and Cost of Debt, as well as the estimation of the intrinsic value of the company based on its future cash flows and terminal value.
| WACC | Forecast | Terminal Year |
| WACC1 | 6.4% | 7.76% |
| Cost of Equity | ||
| Rf2 | 4.00% | 4.00% |
| Beta2 | 0.65 | |
| Adj. Beta1 | 0.65 | 0.89 |
| ERP1 | 5.70% | |
| Cost of Equity1 | 4.8% | |
| Growth Rate (%) | ||
| Return3 | 7.6% | |
| Retention Rate4 | 51% | |
| Growth3 | 7.6% | |
| Cost of Debt | ||
| Avg. Interest Rate2 | 2.80% | |
| Fed Fund Rate (%)5 | 5.50% | 5.50% |
| Gross Cost of Debt | 13.55% | |
| Tax rate1 | 20.5% | 20.5% |
| After Tax Cost2 | 4.6% | |
| Capitalisation6 | 437.19 | |
| Debt7 | 22.13% | |
| Equity | 77.87% |
Cost of Equity: Estimating the Novo Nordisk’s cost of equity, the Capital Asset Pricing Model (CAPM) is used. This takes into account the risk-free rate, market risk premium, and beta of the company’s stock.
The risk-free rate of return is the rate of return that an investment with zero risk is expected to provide. Although no investment is entirely risk-free, the debt obligations issued by the U.S. Department of the Treasury are considered to be risk-free because they are backed by the ‘full faith and credit’ of the U.S. government. The return on risk-free assets is usually close to the current interest rate, and for Novo Nordisk, the risk free rate is 4.00%.
The equity risk premium (ERP) measures the difference between a risky stock and the risk free stock. The ERP is 5.70%, which is the average of the low and high rate of 5.20% and 6.20%. Compared to the risk-free, the ERP will be 1.7% higher than the risk-free investment.
According to a report8, a good ROI for investment generates around 7%. With 4.8% cost of equity, Novo Nordisk is still worthy of an investment that generates decent returns, but with no excess profit compared to others that generate above 7.0% returns.
Cost of Debt: The cost of debt reflects the default risk of a company, as well as the level of interest rates in the market. Novo Nordisk’s average interest rate is 2.8%, which is way lower compared to the Federal Fund Rate of 5.50%. The gross costs of debt of the company accumulated to 13.55%.
In the US, the nominal federal corporate tax rate is approximately 21%. The after tax debt rate is 4.6% for the period estimated. These help to analyse the profitability and competitiveness of Novo Nordisk based on tax rates and effective tax rates.
Growth Rate: Growth rate is analysed for the valuation. Importantly, for a company to be highly profitable regarding investment, its growth rate should be well above the inflation or the nominal GDP growth. The nominal U.S GDP growth rate was 7.375% in December 20239, less than the 7.6% growth rate of Novo Nordisk. Also, the annual inflation rate of the U.S for the 12-month ended July is 3.2%, which is also less than the growth rate of the company’s 7.6%. Novo Nordisk has been paying dividends to its shareholders, and thus, its retention growth is 51%.
Capital Structure: Novo Nordisk’s capital structure is characterised by a dual-class share structure; A and B share capital. The A shares are held by Novo Holdings A/S, but not listed, and cannot be divested according to the Articles of Association of the Foundation. As of September 9, 2023, Novo Holdings A/S also held a B share capital of nominally 437.19 billion USD. Its total debt balance is 96.18 billion USD (22%), while the company’s equity is 341.01 billion USD (78%).
Sources: Value Investing1, FinBox2, The Motley Fool3, Simply Wall St4, Bank Rate5, Companies Market Cap6, Markets FT7, Forbes Advisor8, Ceic Data9
Discounted Cash flow: Growth and Multiple Methods
Discounted cash flow (DCF) analysis uses financial modelling techniques that can be applied to estimate the intrinsic value of an investment based on its future cash flows. In this case, DCF analysis provides valuable insights into the financial health and valuation of Novo Nordisk.
| Free Cash Flow $million | 2023F | 2024F | 2025F | 2026F | Terminal Year |
| Periods | 1 | 2 | 3 | 4 | |
| Discount Rate | 6.4% | 6.4% | 6.4% | 6.4% | 7.76% |
| Discount Factor | 0.94 | 0.88 | 0.83 | 0.78 | |
| Free Cash Flow | 10,840.70 | 12,435.37 | 14,264.61 | 16,362.93 | |
| PV of Free Cash Flow | 10,190 | 10,943 | 11,840 | 12,763 |
| Growth Model $billion | |
| Enterprise Value1 | 437.19 |
| TV % of EV | 53% |
| Cash2 | 5.3 |
| Debt3 | 2.837 |
| Equity Value4 | 112.7 |
| Shares Outstanding5 | 2.251 |
| Fair Value Per Share6 | 196.11 |
| Current Price | 195.40 |
| Upside/Downside | 0.18% |
| Multiple Method $million | |
| EV/EBITDA8 | 34.88 |
| Forward EBITDA7 | 20.1x |
| Cash | 5.3 |
| Debt | 2.837 |
| Equity Value | 196.11 |
| Shares Outstanding | 2.251 |
| Fair Value Per Share | 196.11 |
| Current Price | 195.40 |
| Upside/Downside | 0.18 |
All values values are in billion USD except the fair value per share
The free cash flow forecasted above are computations of a five year period discounted at 6.4% WACC, including a terminal WACC of 7.76%. The intrinsic present value (PV) of the future projected cash flow increases with each year, and this provides insight to the company’s financial health for each year to 2026. The enterprise is valued at 437.19 billion USD, with equity value of 112.7 billion USD.
Using the multiple method, the EV/EBITDA is 34.88 as at the time of writing. The median EV/EBITDA between the period of 2018 and 20227 was 16.2x, while its average is 20.1x. Novo Nordisk’s cash at hand is 5.3 billion USD against the 2.837 billion USD it owed in debt. This shows the company has a net equity of more than 2.4 billion USD. Additionally, the fair value per share is 196.11 USD, which was the highest closing price for the stock.
Sources: Companies Market Cap1, Novo Nordisk2, Macrotrends3, Macroaxis4, Macrotrends5, Yahoo Finance6, FinBox7, Guru Focus8
Investment Recommendation
Novo Nordisk is presently the best stock you can trade as an avid investor. In September, the company’s stock became the largest and most valuable in Europe. Looking at how prices has changed, and the hype surrounding the investment, the company will most likely continue to do well, most especially, looking at the forecasted cash flow, and how revenues and net profits keep increasing each year. This is not advice. Always do your own research.
Frequently Asked Questions
Since its Initial Public Offering (IPO), Novo Nordisk has returned a +52,344% yield for its investors. As of August 29th, 2023, Novo Nordisk’s record stock price was 190.37 USD.
How has Novo Nordisk’s financial performance been in recent years?
Novo Nordisk has shown consistent growth in revenue, gross profit, and net income over the past few years. The company’s revenue in 2022 was 25,056.69 million USD, with a net income of 7,862.34 million USD.
Based on a two-stage discounted cash flow analysis, Novo Nordisk’s revenue is forecasted to reach 32,093.81 million USD by 2025, with a net income of 9,553.60 million USD.
Given its consistent financial performance, growth projections, and strong market position, Novo Nordisk is considered a promising investment opportunity.