In stock trading, having an edge can make all the difference. Technical indicators can be such a thing that gives you that extra edge. These mathematical tools allow you to judge market sentiment and based on that try to predict price movements. Some of them will indicate if a stock is oversold or over-bought indicating either that there is a buy or a sell opportunity in that stock. Others will indicate a break-out level or a reversal level.
If you understand technical indicators that could mean the difference between profitable and unprofitable trading. In this article, we will go through 15 technical indicators that you will find in many stock trading apps. In the end, we will also talk about how you can combine different indicators for even more informed trading decisions. Be aware that you need to combine technical analysis with fundamental analysis.
Moving Averages (MA)
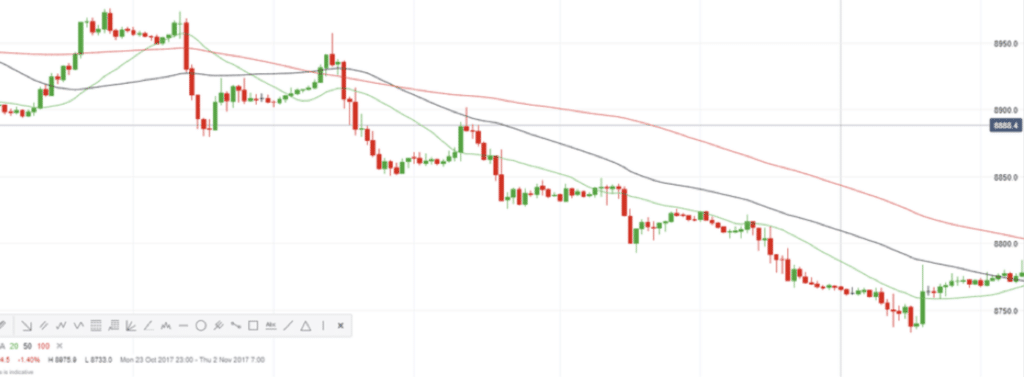
Moving Averages smooth out price data to create a single flowing line, which makes it easier for traders to identify the direction of the trend.
- Simple Moving Average (SMA): This is the average stock price over a specific number of periods. It’s straightforward and gives equal weight to all prices within the period.
How it works: If you’re looking at a 10-day SMA, you’d sum up the closing prices for the last 10 days and divide by 10. - Exponential Moving Average (EMA): Unlike the SMA, the EMA gives more weight to recent prices. This means it reacts more quickly to price changes than the SMA.
How it works: The calculation is a bit more complex, involving both the current price and the previous day’s EMA. This indicator allows you to catch trends earlier.
Moving Average Convergence Divergence (MACD)
MACD is a trend-following momentum indicator that reveals the relationship between two moving averages of a stock’s price.
How it works: MACD is calculated by subtracting the 26-period EMA from the 12-period EMA. The result of that calculation is the MACD line. A nine-day EMA of the MACD called the “signal line,” is then plotted on top of the MACD line, which can function as a trigger for buy and sell signals.
For you to be in the know, when the MACD crosses above the signal line, it’s a bullish sign, suggesting it might be time to buy. Conversely, when it drops below the signal line, it’s a bearish sign.
Relative Strength Index (RSI)
RSI is a momentum oscillator that measures both the speed and the change of price movements. It oscillates between zero and 100 and is typically used to identify overbought or oversold conditions in a traded security.
How it works: If the RSI is above 70, it generally means the stock is overbought and might be overvalued. If it’s below 30 though, the stock might be oversold and that could indicate that it is undervalued. This can allow you to spot potential buy or sell opportunities.
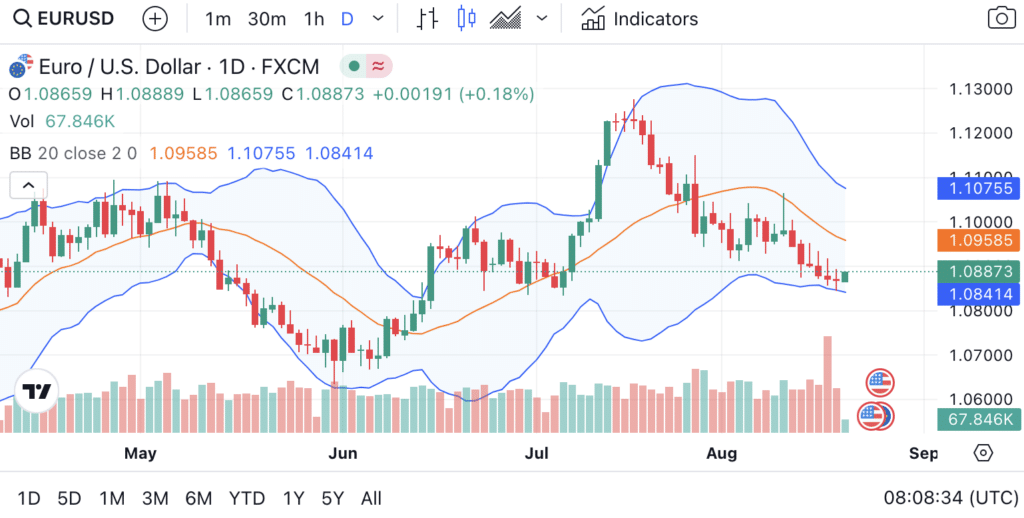
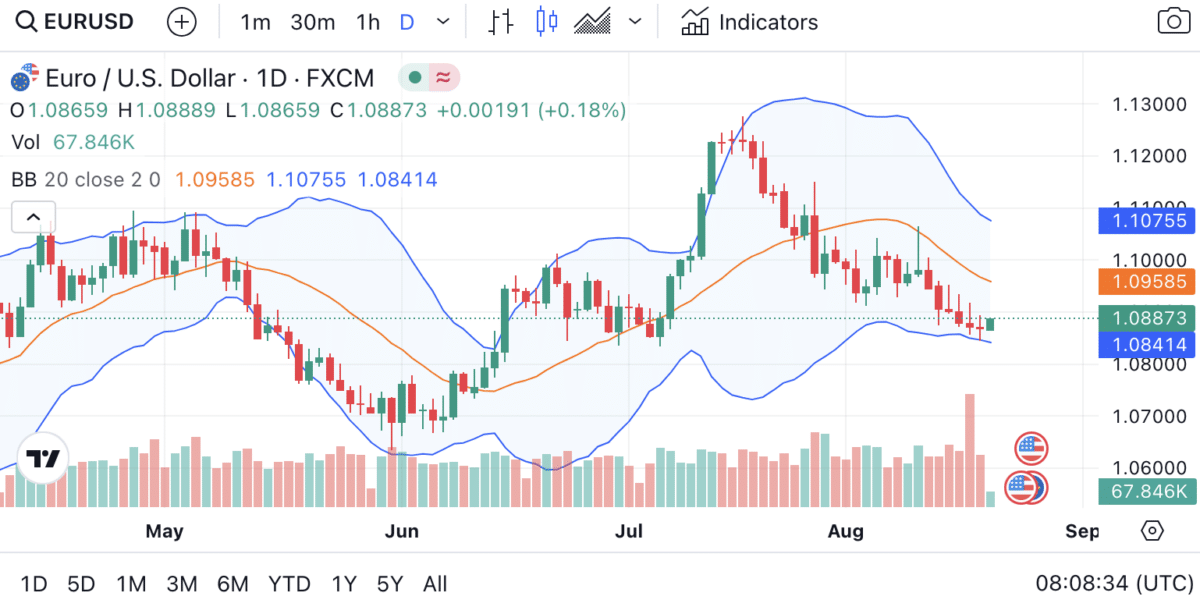
Bollinger Bands
Bollinger Bands consist of three lines: the middle, upper, and lower bands. These bands aim to capture the majority of a stock’s price movement, also helping traders to identify overbought or oversold conditions.
How it works: The middle band is the SMA, usually set for a 20-day period. The upper and lower bands are standard deviations away from the SMA.
| Band | Calculation |
|---|---|
| Middle | 20-day Simple Moving Average |
| Upper | 20-day SMA + (20-day standard deviation of price x 2) |
| Lower | 20-day SMA – (20-day standard deviation of price x 2) |
When the stock price touches the upper band, it might be overbought, and when it touches the lower band, it might be oversold.
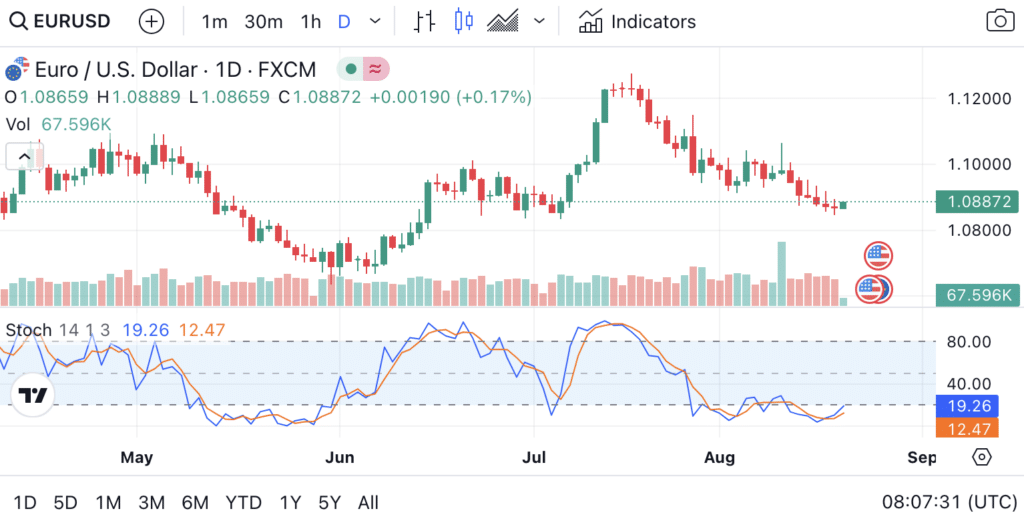
Stochastic Oscillator
This momentum indicator compares a stock’s closing price to its price range over a specific time frame, usually 14 days.
How it works: The Stochastic Oscillator produces values between 0 and 100. Readings above 80 often indicate that a stock is overbought, while readings below 20 suggest it’s oversold.
Fibonacci Retracements
These are horizontal lines that indicate potential support and resistance levels for a stock price. The horizontal lines are based on the Fibonacci sequence, a series of numbers where each number is the sum of the two preceding ones.
How it works: After a significant price movement, traders can use Fibonacci retracement levels to predict where a stock might retrace before continuing in its original direction. Common retracement levels are 23.6%, 38.2%, 50%, 61.8%, and 78.6%.
Volume
Volume is a straightforward indicator, representing the number of shares traded during a specific timeframe. It’s a great tool if you want to judge the strength of a price movement.
How it works: If a stock price increases with high volume, it naturally is a sign that the upward trend is strong and likely to continue. Conversely, if the stock price decreases on high volume, the downward trend is robust.
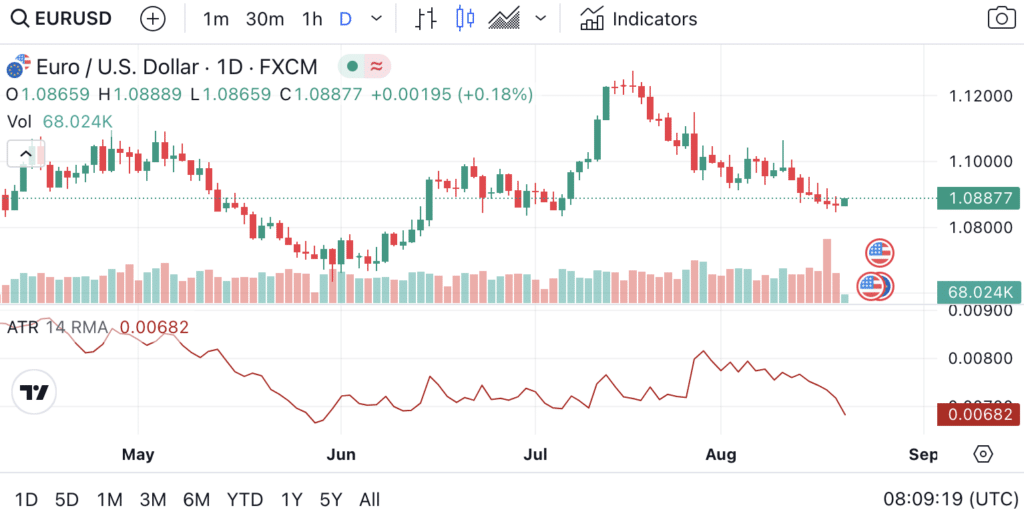
Average True Range (ATR)
ATR measures market volatility by looking at the difference between the high and low prices for a period.
How it works: The ATR is typically calculated over 14 periods. If the ATR is increasing, it suggests that the volatility is increasing, while a decreasing ATR indicates decreasing volatility.
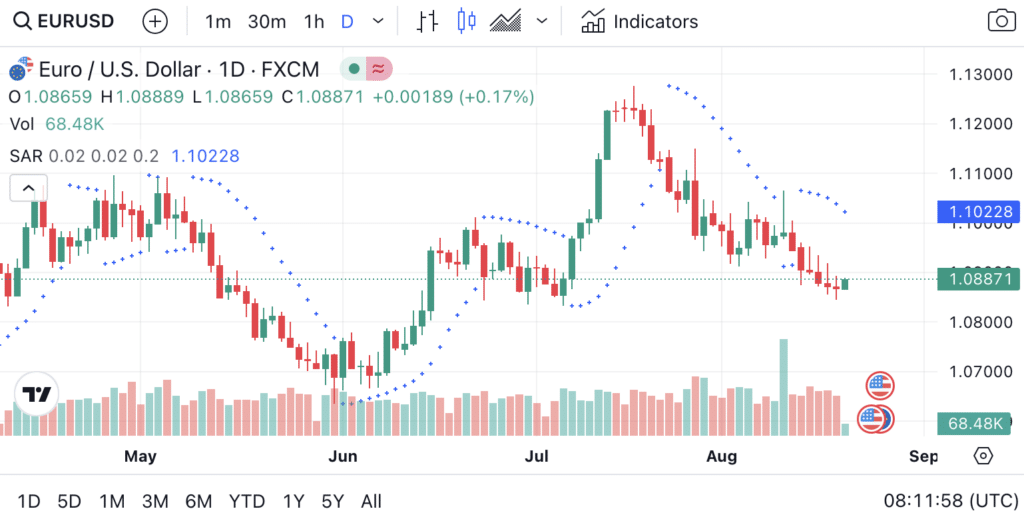
Parabolic SAR (Stop and Reverse)
The Parabolic SAR provides potential entry and exit points based on a stock’s price movement. It appears as dots either above or below the price chart, indicating the current direction of the price.
How it works:
- When the dots are below the price chart, it indicates an upward trend, suggesting a potential buy signal.
- When the dots are above the price chart, it indicates a downward trend, signaling a potential sell.
| Position of Dot | Indication |
|---|---|
| Below price chart | Upward trend (Buy signal) |
| Above price chart | Downward trend (Sell signal) |
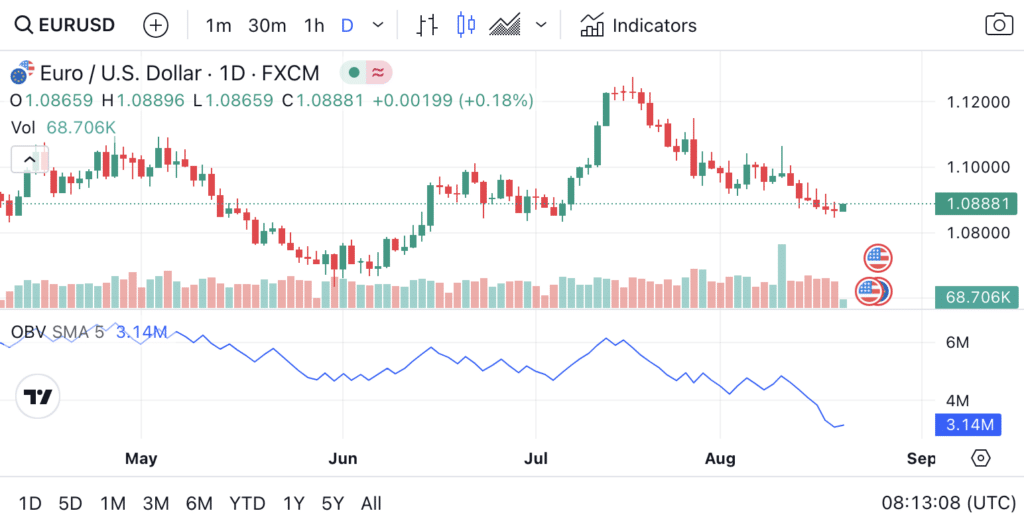
On-Balance Volume (OBV)
OBV is a momentum indicator that uses volume flow in a stock to anticipate price changes. It cumulatively adds or subtracts each period’s volume, depending on the price movement.
How it works:
- If the closing price is higher than the previous day, the volume is added.
- If the closing price is lower, the volume is subtracted.
This continuous addition or subtraction gives the OBV line, which can be plotted alongside the stock’s price chart.
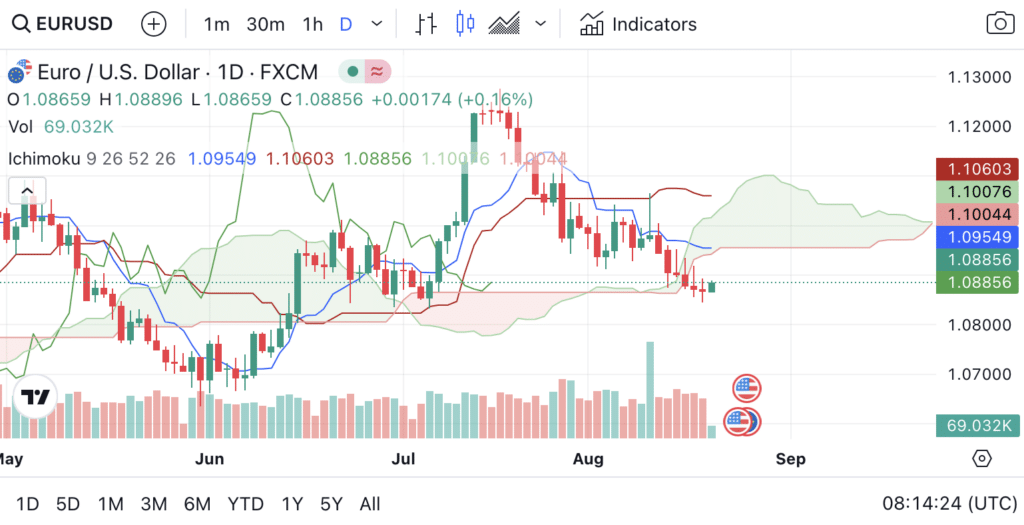
Ichimoku Cloud
The Ichimoku Cloud also provides support and resistance levels, it further identifies the direction of the trend and also the strength in the momentum. It consists of five lines: Tenkan-sen, Kijun-sen, Senkou Span A, Senkou Span B, and Chikou Span.
| Line | Calculation |
|---|---|
| Tenkan-sen | (9-period high + 9-period low) / 2 |
| Kijun-sen | (26-period high + 26-period low) / 2 |
| Senkou Span A | (Tenkan-sen + Kijun-sen) / 2, plotted 26 periods ahead |
| Senkou Span B | (52-period high + 52-period low) / 2, plotted 26 periods ahead |
| Chikou Span | Current closing price, plotted 26 periods behind |
The space between Senkou Span A and Senkou Span B forms the “cloud,” which can be shaded green for bullish signals or red for bearish signals.
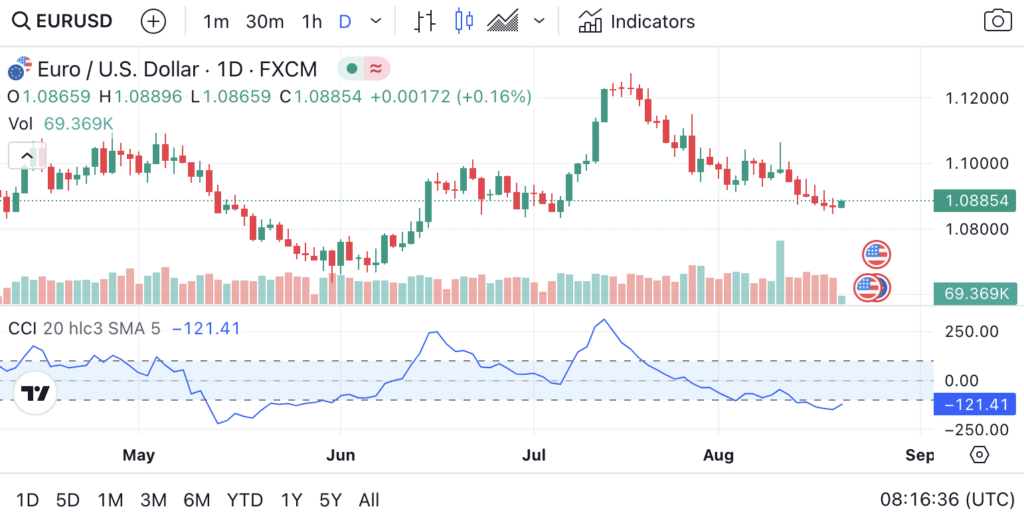
Commodity Channel Index (CCI)
CCI determines whether a stock is overbought or oversold. The CCI measures the current price level relative to an average price level over a given period.
How it works:
- Readings above +100 typically indicate that the stock is overbought.
- Readings below -100 suggest that the stock is oversold.
The CCI can be used to identify reversals or breakouts.
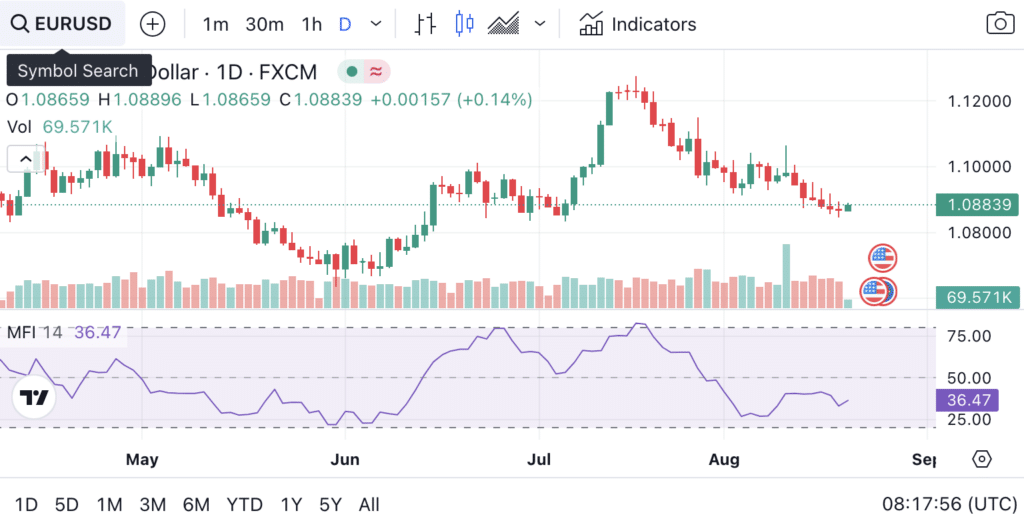
Money Flow Index (MFI)
The MFI is often referred to as a volume-weighted RSI. It incorporates both price and volume data to measure buying and selling pressure.
How it works:
- MFI values range between 0 and 100.
- An MFI above 80 typically indicates that the stock is overbought, suggesting a potential price drop.
- An MFI below 20 indicates that the stock is oversold, signaling a potential opportunity for an increase in price.
| MFI Value | Indication |
|---|---|
| Above 80 | Overbought |
| Below 20 | Oversold |
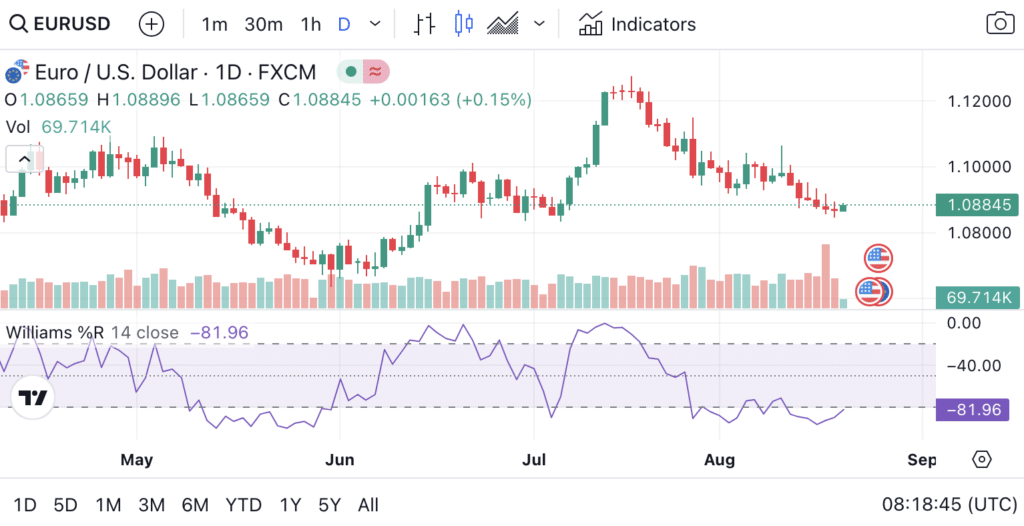
Williams %R
Williams %R, also known as the Williams Percent Range, is a momentum indicator that also measures overbought and oversold levels.
How it works:
- The indicator oscillates between 0 and -100.
- Readings above -20 are considered overbought.
- Readings below -80 are considered oversold.
| Williams %R Value | Indication |
|---|---|
| Above -20 | Overbought |
| Below -80 | Oversold |
Pivot Points
Pivot Points are also used to determine potential support and resistance levels based on the previous trading session’s high, low, and closing prices.
How it works: The main pivot point (PP) is calculated as:
PP=(High+Low+Close)/3
From this, various support and resistance levels can be derived:
| Level | Calculation |
|---|---|
| R1 (Resistance 1) | (2 x PP) – Low |
| R2 (Resistance 2) | PP + (High – Low) |
| S1 (Support 1) | (2 x PP) – High |
| S2 (Support 2) | PP – (High – Low) |
Traders use these levels to identify potential price reversal points where they should sell or buy.
Combining Technical Indicators for Advanced Analysis
In the world of stock trading, relying on a single technical indicator can be akin to navigating a vast ocean with just a compass. While it might point you in the right direction, you’d undoubtedly benefit from a map, a sextant, and perhaps even a seasoned crew. Similarly, by combining multiple technical indicators you can get a more holistic view of the market, that you can use for even more informed trading decisions. Below we will guide you through how you can combine technical indicators to your advantage.
First, identify the Trend
Before starting to trade, it’s essential to identify the prevailing trend. For this, trend-following indicators like Moving Averages and the MACD can be invaluable.
- If the price is above the Moving Average, it’s indicative of an upward trend.
- A bullish MACD crossover (where the MACD line crosses above the signal line) can further confirm this trend.
Then, confirm the Trend
Once you’ve identified a trend, you need to make sure it’s not a false signal. This is where momentum indicators like RSI and Stochastic Oscillator come into play.
- An RSI value above 70 in an upward trend might indicate it’s overbought, suggesting caution.
- Similarly, a Stochastic Oscillator moving above 80 could hint at the same.
Spot Potential Entry and Exit Points
With the trend identified and confirmed, the next step is to find optimal entry and exit points. Bollinger Bands and Pivot Points can be particularly useful here.
- When the price touches the lower Bollinger Band and turns upwards, it can be a good entry point in an upward trend.
- Pivot Points, with their support and resistance levels, can help identify potential price reversal points or breakout levels.
Assess Volatility
To know market volatility can help you in setting the right stop-loss and take-profit levels. Average True Range (ATR) is a tool designed for this.
- A higher ATR indicates higher volatility, suggesting wider stop-loss and take-profit levels.
- Conversely, a lower ATR might mean the market is moving sideways, and tighter stops could be set.
Analyse Volumes
Volume can validate the strength of a trend. You can combine the On-Balance Volume (OBV) indicator with other indicators to confirm their signals.
- If the price is rising and OBV is moving up, it confirms the strength of the upward trend.
- If the price is falling but OBV is rising, it might indicate a potential bullish reversal.
Tips for Combining Indicators:
- Avoid Redundancy: If you use multiple indicators that tell you the same thing this can lead to over-analysis. For instance, RSI and Stochastic are both momentum indicators; using them together might not provide any additional insight.
- Less is More: While it’s tempting to use many indicators, it can lead to analysis paralysis. Choose a few that complement each other and stick to them.
- Always Use in Conjunction with Fundamental Analysis: While technical indicators are powerful, remember that they are not giving you the whole truth! You need to use them alongside fundamental analysis to make correct trading decisions.
- Backtest: Before committing to a combination of indicators, backtest your strategy on historical data to see how it would have performed.
In essence, combining technical indicators is an art as much as it is a science. As you can understand, it requires practice, patience, and continuous learning. But with the right combination, you can improve your trading strategy, making it more resilient to the ever-changing market. As you now understand, technical indicators are great tools when investing in stocks.
Most of the technical indicators we talked about in this article should be available in your stock trading app. To see a list of all features that you’d be looking for in a stock trading app, click here.