Employees either lose their jobs or resign to a more suitable one every year. Therefore, the proportion of employed individuals to the unemployed changes each year. In fact, these changes account for the differences and fluctuations in the rate of unemployment that the world has witnessed and is witnessing till date.
According to Statista, the global unemployment rate since 2003 has been unstable. Between each year, the number is either rising or falling. The last five years, from 2018-2022, illustrate the upward-downward trend of the global unemployment rate. Ascendingly, 5.7%, 5.54%, 6.9%, 6.2%, and 5.77% have the statistics proved.
UK unemployment has been going forth and back like the world unemployment rate. The unemployment stats from 2018 through 2022 are 4%, 3.74%, 4.47%, 4.8%, and 3.57%. Statistically, the global and UK unemployment rate tends to rise in 2020. The reason for this is apparent; the covid-19 pandemic result.
Sources: Statista 1, Statista 2
So, as a fundamental barometer of economic health, the UK unemployment rate presents invaluable insights for policymakers, businesses, and individuals alike. Our analysis comprehensively explores:
- Snapshot of UK Unemployment Rate Statistics
- UK Demographic Unemployment Statistics
- UK Regional Unemployment Statistics
- UK Unemployment Rate Comparison with Other Countries
- UK Unemployment Forecast and Government Policies
Snapshot of UK Unemployment Rate Statistics
- Feb-April 2023: The unemployment rate (aged 16+) was 3.8%
- Feb-April 2023: The unemployment rate in the UK was 76%. Only 0.2 percentage points higher from November 2022 to January 2023.
- April 2023: UK accounts for 257,000 working days lost. This was due to labor disputes.
- Jan-March 2023: The UK employment rate was at 75.9%—only 0.2 percentage points above October to December 2022.
- Total Unemployed: In April 2023, the total number of unemployed in the UK was 1.3 million.
- Total Employed: According to payrolled employees in March 2023, the total number of employed in the UK amounted to 30 million.
- Employment Status: Between Feb-April 2023 in the UK, the number of the newly recruited working class on a full-time basis is 24.64 million. On the contrary, 8.45 million people were recruited on a part-time basis.
- Regional Breakdown: Between Jan-March 2023, Wales’s unemployment rate was 4.6%. In England, it was 4%. Scotland witnessed 3.1% of the unemployment rate, while Northern Ireland, 2.5%, had the least.
- The number of job vacancies dropped by 55,000 between Feb-April 2023 and the number seen between Nov 2022 to January 2023.
- Germany (3.0%) and the US (3.5%) rated below UK unemployment (3.9%) in 2023’s Q1. France (7%) is nearly twice as much as the UK.
Sources: Office for National Statistics 1, Office for National Statistics 2, Office for National Statistics 3, Statista 1, Office for National Statistics 4, UK Parliament 1, Statista 2, Office for National Statistic 5, UK Parliament 2
Historical Unemployment Rate
The historical unemployment rate kicked off in the UK as early as 1973. This was due to stagflation experienced, coupled majorly with oil shocks. During this course, miners commenced their three-day week strike on 1 January 1974, as announced in December 1973.
Notably, the UK record of 3.4% unemployment in late 1973 and early 1974 is the lowest record. However, the highest record the UK has ever witnessed was the 11.9% recorded in 1984. This was largely due to the economic recession.
In the 1990s, the unemployment rate remained high. This was due to an early recession that saw the unemployment rate rise to 10.35% in 1973. However, the end of 1999 saw the unemployment rate dropping to 6.04%.
Fast forward to the 2000s, the UK unemployment started at 5.56% and ended the decade at a 7.54% high. Additionally, between 2010 to 2019, the unemployment rate in the UK began high but ended with 3.74% in 2019. That’s critically low, just as almost as it was in late 1973 to early 1974.
This decade, so far, unemployment rates have been going forth and back every year. For example, the rates from 2020 to April 2023 stood at 4.47%, 4.83%, 3.57%, and 3.85%. However, covid-19 played a huge part, especially when companies had to cut back their expenses by laying off workers. Some, however, practised the furlough schemes.
Statistically, let’s have a bird’s view of how the UK unemployment rates have historically gone by. The stats only featured from 1999 to April 2023. The graphical illustration is represented below.
Table 1: The UK employment history from 1999-April 2023
| Year | Unemployment Rates (%) |
| 1999 | 6.04 |
| 2000 | 5.56 |
| 2001 | 4.7 |
| 2002 | 5.04 |
| 2003 | 4.81 |
| 2004 | 4.59 |
| 2005 | 4.75 |
| 2006 | 5.35 |
| 2007 | 5.26 |
| 2008 | 5.62 |
| 2009 | 7.54 |
| 2010 | 7.79 |
| 2011 | 8.04 |
| 2012 | 7.89 |
| 2013 | 7.52 |
| 2014 | 6.11 |
| 2015 | 5.3 |
| 2016 | 4.81 |
| 2017 | 4.33 |
| 2018 | 4 |
| 2019 | 3.74 |
| 2010 | 4.47 |
| 2021 | 4.83 |
| 2022 | 3.57 |
| 2023* | 3.8 |
Sources: Data from Statista 2023
Figure 1: Graphical Illustration of the UK Employment Rate

UK Current Unemployment Rate 2023
UK Demographic Unemployment Statistics
Demographic statistics involve categorizing the unemployed. Factors that contribute to these statistics are many, but in this comprehensive analysis, we’ll narrow it down to just three, including:
- Unemployment Rate by Age Group
- Unemployment Rate by Gender
- Unemployment Rate by Race
Unemployment Rate by Age Group
According to the UK Government, the age barometer for working is set between 13 to 64. However, we want to be more realistic with our analysis. We, thereby, upgrade this age by looking at the UK employment rate between 16 and 64. Seniors and minors are overlooked when estimating the unemployment rate.
Source: UK Government
Breaking down the numbers by age, we see significant differences in unemployment rates. Here is the breakdown from Nov-Jan 2022 to Feb-April 2023:
Age Group 16-17: 58.2%
Age Group 18-24: 26.3%
Age Group 25-49: 8.1%
Age Group 50-64: 7.4%
Figure 2: Unemployment Rate by Age Group
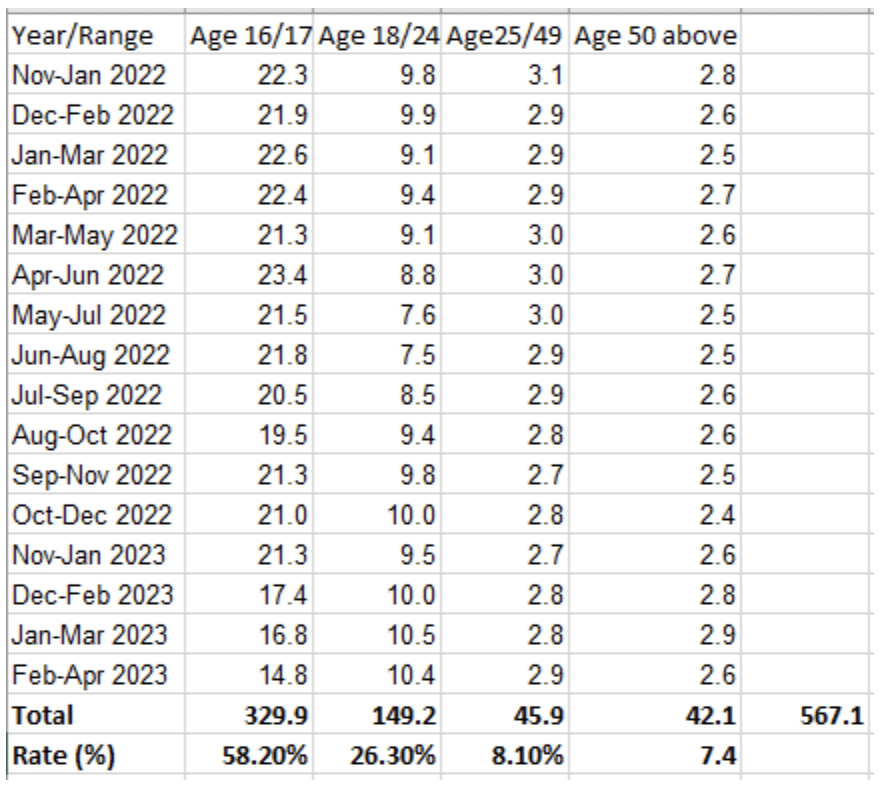
The analysis takes into consideration as seen above, Nov-Jan 2022 to Feb-April 2023. Moreover, this is for age groups between 16 and 64, and can be well represented in the chart below.
By year and age range:
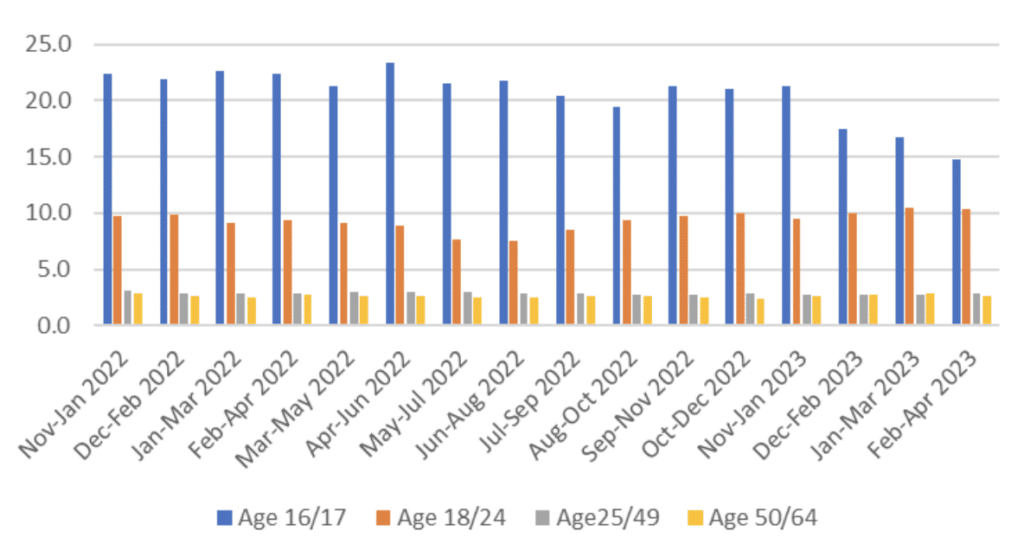
According to each timeline, the chart above proves that people between the ages of 50 and 64 work more in the UK than the other groups. Meanwhile, people in the bracket of 35-49 follow, with the age group 16-17 coming the least. This means there is more working class between 18 and 24 than there was for 16-17.
By age range and unemployment rates:
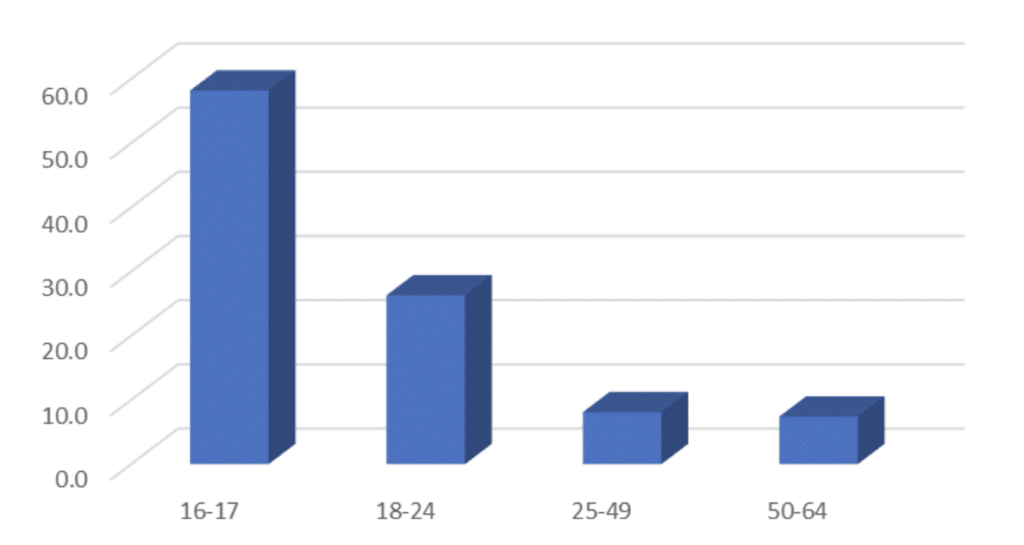
When we compare the overall stats from Nov-Jan 2022 to Feb-April 2023, we can infer significant differences among these age groups. As represented above, the age groups’ unemployment rates by the timeline are as follows: 16-17 (58.2%), 17-24 (26.3%), 24-49 (8.1%), and 50-64 (7.4%).
Unemployment Rate by Gender
In terms of gender, the unemployment rate also varies. The unemployment rate for males is 51.6%, and for females is 48.1%. However, how do we get these figures? The source is below the pictorial data.
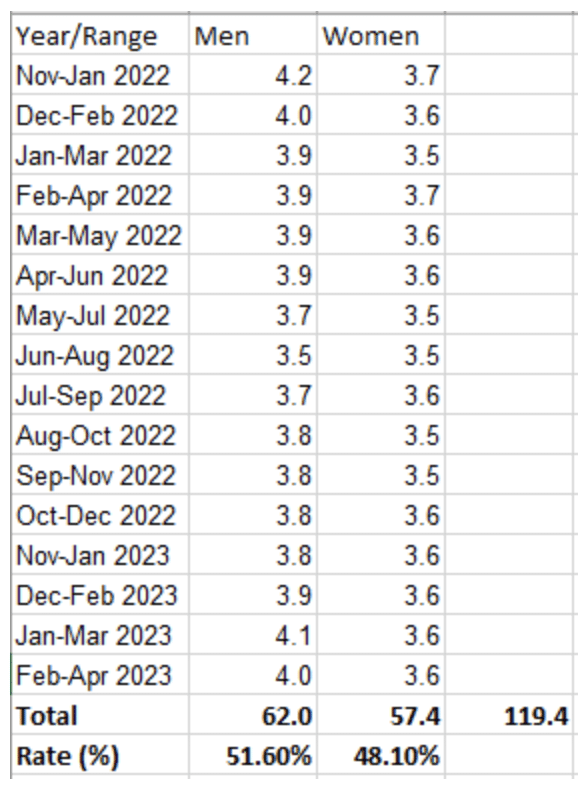
While this analysis covers the timeline above, here’s the chart below:
By unemployment rate and the year:
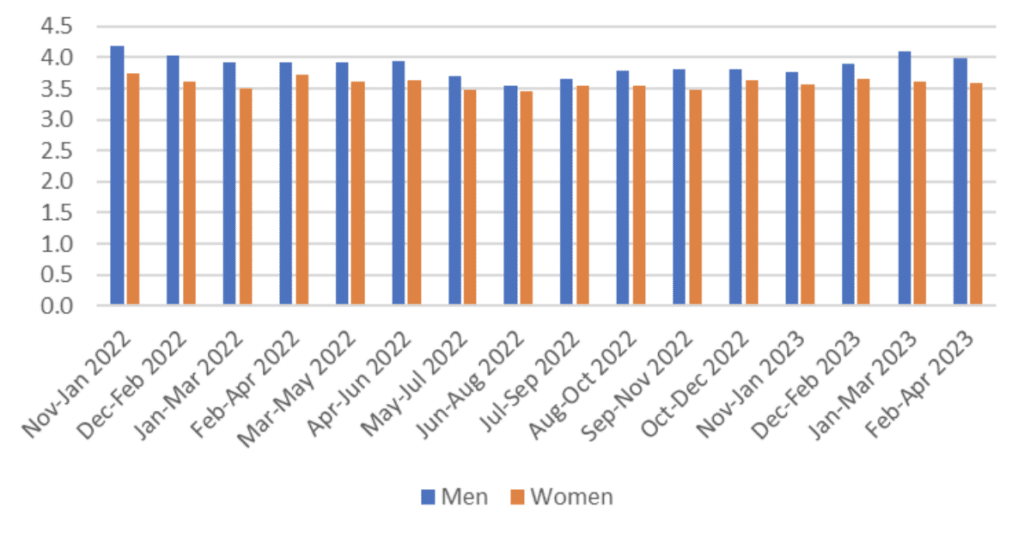
Comparing each unemployment rate side by side each year, it’s evident that the rate of men that are unemployed is more than the unemployed women. Going further, let’s see how the pie chart looks.
By gender and unemployment rates:

The chart gives a proper view of what the gender unemployment rate looks like in the UK. The chart above shows that the unemployed men (51.6%:Blue) are more than the women (48.1%:Orange) seeking employment in the country.
Unemployment Rate by Ethnicity
The UK encompasses multiple ethnicities. So, this section looks at the rate of unemployed whites compared to other races in the country. The race-based discrepancies address structural issues in play.

By quarter and Ethnicity:
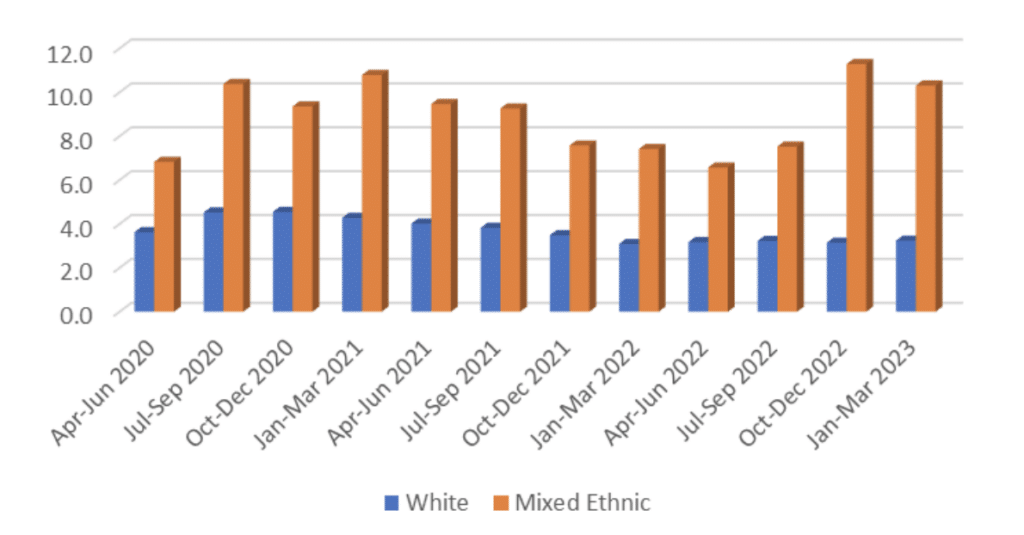
The comparison of the quarterly unemployment rate among white and other ethnicities in the UK is significantly high. This denotes that the unemployed whites are significantly lesser, while other ethnicities are hugely unemployed. In short, the statistics above prove that more than double the white is employed against the other group in the UK.
Let’s compare their rates in a pie chart.
By ethnicity and unemployment rate:
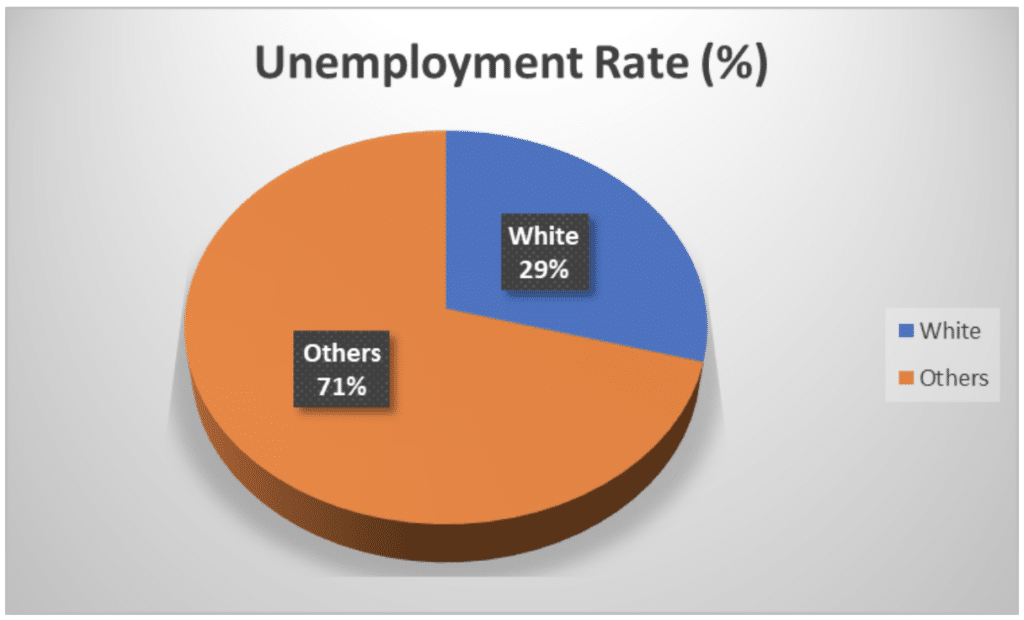
From the graph above, it’s clear and glaring that the unemployed are far behind the unemployed of other races in the UK.
UK Regional Unemployment Statistics
The United Kingdom comprises four countries: England, Scotland, Wales, and Northern Ireland. These countries are also defined by their regions. Basically, Wales’s unemployment rate is 4.6%. In England, it’s 4%. Scotland has 3.1% of the unemployment rate, while Northern Ireland, 2.5%, is the least.
The regional employment statistics in the UK have been upward since 2013 after the country underwent a financial crisis in 2008/2009. Presently, the West Midlands has the highest unemployment rate of 5.1%. The South West and Northern Ireland had the lowest rate of unemployment.
While many factors affect regional unemployment, let’s compare and look at the lowest unemployment rate in the UK region.
Lowest Unemployment Rates by Region
According to the Office of National Statistics, UK, these three regions are the least with unemployment:
#3 Scotland
Unemployment Rate: 3.1%
Labour Force: 2.7 million
Scotland has the third lowest unemployment rate in the UK. The rate is 3.1%. This means that 3.1% of people who can work and want to work are not currently employed. The 3.1% unemployment rate also represents a fraction of the 2.7 million people in Scotland’s labor force.
Scotland boasts a diverse and robust economy with several thriving sectors. The oil and gas industry, particularly centered around Aberdeen, plays a significant role.
Source: The Scottish Government
#2 South West
Unemployment Rate: 2.5%
Labour Force: Nil
The South West region has the second lowest unemployment rate in the UK. The rate is 2.5%. So, in the South West, 2.5% of people who want to work and can work are not currently working. The data about how many people are in the labor force – that is, working or looking for work – is unavailable.
South West, Uk, is known for many things. These include things like Cheddar cheese. It’s also known for its manufacturing industries, especially aerospace and defense. For instance, Airbus has significant operations in Bristol.
#1 Northern Ireland
Unemployment Rate: 2.5%
Labour Force: 788,400
Northern Ireland has the lowest unemployment rate in the UK. The rate is 2.5%, the same as the South West. In a real sense, only 2.5% of people who can work and want to work are not working. Also, the total labor force in the region is 788,400 people.
Industries characterize Northern Ireland’s economy. These include agriculture, shipbuilding, textiles, and, increasingly, technology and creative industries in cities like Belfast.
Source: Northern Ireland Executive
Comparison of Regional Unemployment Rates
This comparative analysis will help understand the regional unemployment rates scale of disparities. The data are, thus, listed below.
| Region | Unemployment Rate (%) |
| England | 4 |
| North East | 4.2 |
| North West | 3.3 |
| Yorkshire and The Humber | 3.9 |
| East Midlands | 3.7 |
| West Midlands | 5.1 |
| East | 4 |
| London | 4.7 |
| South East | 3.7 |
| South West | 2.5 |
| Wales | 4.6 |
| Scotland | 3.1 |
| Northern Ireland | 2.5 |
Source: Office for National Statistics
What are the Factors Contributing to these Regional Unemployment Rates?
Below are some of the factors impacting unemployment rates in these UK regions:
- Recession: When the economy slows down, businesses make little money. To cut costs, they might have to let some workers go. This leads to more people being unemployed.
- Technological Unemployment: This happens when machines or computers replace jobs that people do. For example, if a factory uses robots, they might not need as many human workers. However, in the UK, some companies have deployed AI and IoT, with even the UK government spending on testing its impact in the country.
- Regional Difference: Different areas of the UK have different types of jobs. Some places might have more factories, while others might have more offices. So, if a type of job becomes less common, it might affect some areas more than others, triggering higher unemployment in those areas.
UK Unemployment Forecast and Government Policies
The UK unemployment has been doing well since the beginning of this decade. So far, unemployment has been under 5%, which can still go down very much. According to the Global Economy, the unemployment rate will be 4.2% in 2028. However, the world average unemployment rate is predicted to be 6.64%. In a nutshell, the UK unemployment rate is forecast to be lower than the other parts of the world.
Additionally, Statista reports that the UK GDP is predicted to grow by 4.82% by 2026. All things being equal, whatever the government policies will be, it’ll bring more enjoyment. In fact, KPMG predicted that GDP would rise by 0.3% by the end of 2023. They also stressed further that it’ll increase to 1.1% by 2024. There’s a lot of hope that the UK will escape recession.
Sources: The Global Economy, Statista, KPMG
Conclusion
The 3.8% unemployment rate in the UK signifies more than just a figure. It’s historic compared to the previous high. Certain regions have lower unemployment rates compared to other regions in the UK. Scotland, South West, and Northern Ireland have the lowest.
Also, the 3.8% unemployment rate indicates an intricate narrative of demographic interwoven with economic implications and future prospects. This understanding paves the way for targeted, effective strategies to mitigate unemployment challenges in the UK. So, the 3.8% unemployment rate is significantly telling a story about the nation’s economic health.