The UK is one of the top countries in the world that effectively utilizes e-commerce services. According to a report online, at least 82% of UK citizens bought an item online in 2021. In fact, UK consumers’ habits are so easy to understand.
More than 51% of the citizens purchase directly from the email they receive from brands. It’s looking likely that the UK citizens got what they wanted—the e-commerce market. Globally, the UK ranks third largest e-commerce market by online sales.
In this analysis, we will explore the current state of the UK e-commerce market. Also, we will look at its size, annual revenues, top companies, and fastest-growing players.
Key Takeaways on UK E-commerce Statistics
- The UK e-commerce market accounts for 30% of total retail, growing at a CAGR of 8.4% from 2023 to 2027, projected to hit US$230,356.7 million by 2027.
- Internet shopping dominates the UK with 82% of the population purchasing online in 2021, a growth from 78% in 2018.
- UK’s e-commerce revenue reached over $120 billion in 2021, and the B2C market is predicted to reach $285.5 billion in 2022.
- Top UK online shopping categories include clothing (57%), gifts (66%), groceries (54%), and home furnishing (48%).
- 41% of UK consumers prefer online shopping, with 57% believing they find better deals online.
- By 2024, e-commerce is expected to constitute 37.5% of the UK’s retail market.
- Amazon led the UK online market in 2021, earning $17.1 billion.
- Millennials make up 44% of UK’s online shoppers, with 49% preferring computer-based purchases.
- UK shoppers return 34% of online-bought clothing.
The Global E-commerce Market
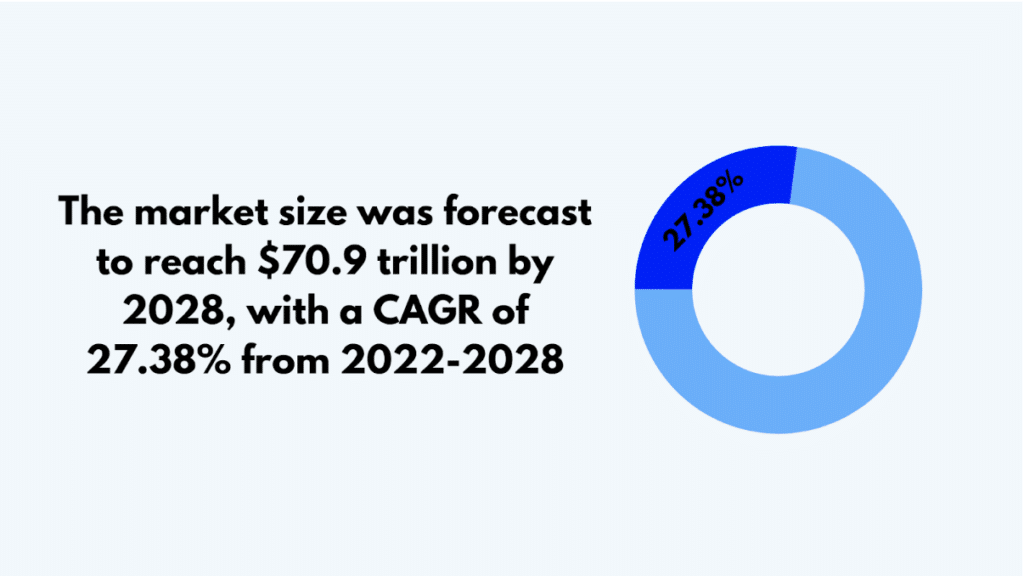
Almost all businesses in the world have shifted online. The e-commerce business is thriving, with 12 to 24 million e-commerce platforms worldwide. In 2022, the global e-commerce market was valued at $16.6 trillion. The market size was forecast to reach $70.9 trillion by 2028, with a CAGR of 27.38% from 2022-2028.
Global E-commerce Market Statistics
- The global e-commerce market was valued at US$ 16.6 trillion in 2022. It’s expected to grow at a compound annual growth rate (CAGR) of 14.7% from 2020 to 2027.
- Global e-commerce sales are expected to total $5.9 trillion worldwide in 2023. This number is expected to grow over the next few years, reaching about $8.1 trillion by 2026.
- In 2023, e-commerce accounts for 20.2% of total retail sales worldwide, increasing to 23.3% by 2026.
- The largest e-commerce markets by country are China, the United States, the United Kingdom, Japan, and South Korea.
- Major global e-commerce platforms include Amazon, Alibaba, eBay, and Walmart.
- Some emerging trends in the global e-commerce market include augmented reality, voice search, artificial intelligence, social commerce, and personalization.
Countries for E-commerce Sales 2023
According to Oberlo, e-commerce sales will exceed $3 trillion in China and $1.1 trillion in the US in 2023. This hints that these two countries are leading regarding how effectively they use e-commerce services.
Let’s look at the top countries for e-commerce sales:
| Countries | E-commerce Sales ($billion) |
| China | 3,023.66 |
| United States | 1,163.49 |
| United Kingdom | 195.97 |
| Japan | 193.42 |
| South Korea | 147.43 |
Sources: Web Retailer, Research and Markets, PR Newswire, Shopify 1, Statista 1, Oberlo 1, and Oberlo 2
Current State of the UK E-commerce Market
The UK is among the top three largest UK e-commerce markets. The prevailing sub-headings that follow will explain more about the current state.
Size of E-commerce Market in the UK
On Statista, these are how the UK e-commerce market size will look like by the end of 2023 and beyond:
- The UK e-commerce market revenue is expected to reach US$141.10bn in 2023
- The UK user penetration of the e-commerce market will be 83.1% in 2023
- The market is expected to hit 86.3% by 2027
- E-commerce users in the UK are expected to amount to 59.23m users by 2027
UK E-commerce Annual Revenues
According to Statista, here are the UK e-commerce annual revenues from 2015-2021 as last recorded:
| Year | Annual Revenues (in £billion) |
| 2015 | 42.6 |
| 2016 | 51.6 |
| 2017 | 59.9 |
| 2018 | 68.5 |
| 2019 | 75.4 |
| 2020 | 112.7 |
| 2021 | 129 |
Top UK E-commerce Companies
| Companies | Net Sales in (US$Million) |
| Amazon | 15,362 |
| Sainsbury | 7,586 |
| Tesco | 7,156 |
| Argos | 4,653 |
| Johnlewis | 3,394 |
Fastest Growing E-commerce Companies in the UK
According to Similarweb, these are the fastest e-commerce companies in the UK as of May 2023 MoM traffic change:
| Companies | MoM Web Traffic Change (in %) |
| Temu.com | 631 |
| Lutontown.co.uk | 417 |
| Wiggle.com | 310 |
| Quickjacklift.co.uk | 171 |
| Littlegreenradicals.com | 142 |
Sources: Statista 1, Statista 2, Statista 3, Similarweb
Consumer Behavior in UK E-commerce
In the UK, consumer e-commerce accounts for 30% of the total retail market, up from 20% in 2020. The annual revenue totaled over $120 billion. Also, 82% of the UK population bought at least one product online in 2021.
The following are the key digital figures for the UK in 2021:
- Population: 68.05M
- Mobile phone connections: 67.61M
- Internet users: 65.32M
- Active social media users: 53M
UK E-Commerce Gender-Based Analysis
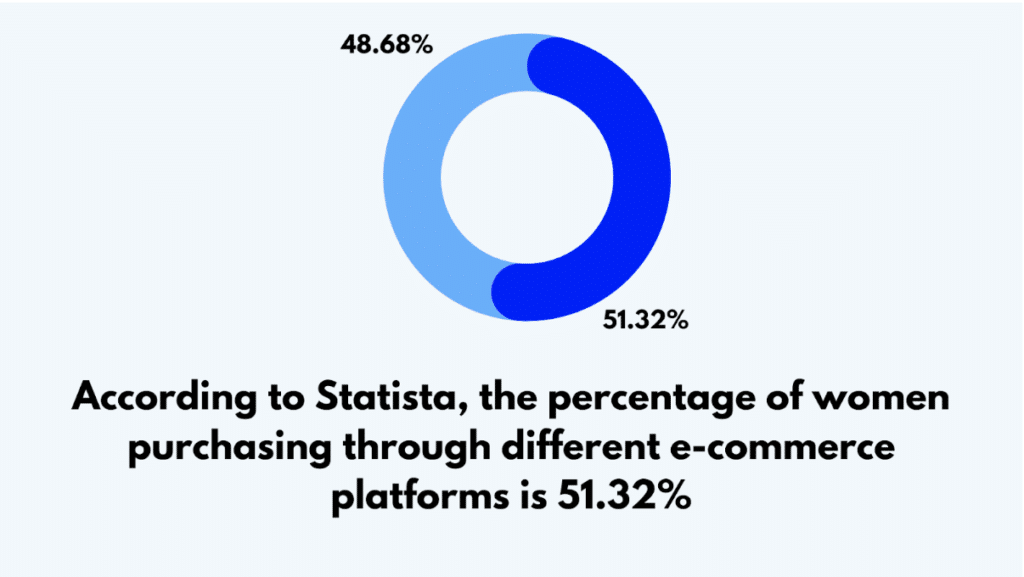
According to Statista, the percentage of women purchasing through different e-commerce platforms is 51.32%. On the other hand, there are only 48.68% of men that use e-commerce platforms for their purchases.
Millennials and Gen Z Shopping Trends in the UK
Physical vs Online Shopping
While 54% of millennials and 51% of Gen Z prefer shopping for food and drink in physical stores, a majority of both groups, 67% of millennials and 69% of Gen Z, reported shopping online for clothes and shoes in Q2 2022.
Brand Preferences
Gen Z is 1.4 times more likely to pay premium prices for products from reputable brands. Conversely, millennials tend to spend more with retailers offering brand-owned mobile apps.
Spending Patterns
In 2020, UK millennials spent an average of $4,516 (£3,250.1) each, significantly more than their counterparts in China and the US. Gen Z, particularly female shoppers, are shaping online shopping trends, with 40% shopping for clothing once or twice per month.
Digital Trends
Millennials lead in digital usage in the UK, with Gen Z being the fastest-growing cohort. Their preferences for online shopping, digital wallets, and mobile apps are driving the growth of the e-commerce market.
UK E-Commerce Product Categories by Sales
| Product Category | Sales (in %) |
| Clothing | 57 |
| Shoes | 37 |
| Books, Movies, Musics and Games | 34 |
| Food and Beverages | 33 |
| Cosmetics and Body Care | 29 |
Sources: International Trade International, CBRE, CyberCrew, Mintel Store, The Drum, Retail Gazette, Office for National Statistics, Statista 1, Statista 2, Internet Retailing, Statista 3.
Mobile Commerce in the UK: Growth and Trends
M-Commerce Adoption and Revenue in the UK
In 2020, mCommerce was adopted by 66.7% of UK shoppers, with revenue projected to hit £105.28 billion by 2024¹.
UK Mobile Shopping Trends and Consumer Behaviour
UK consumers primarily use mobile devices for shopping, with clothing and accessories as the top purchases. The fastest growth in mobile shopping is seen in flight and hotel bookings.
Conversion Rates: Mobile vs Desktop in the UK
Desktop users in the UK have a conversion rate of 5.15%, compared to 2.52% for smartphone users².
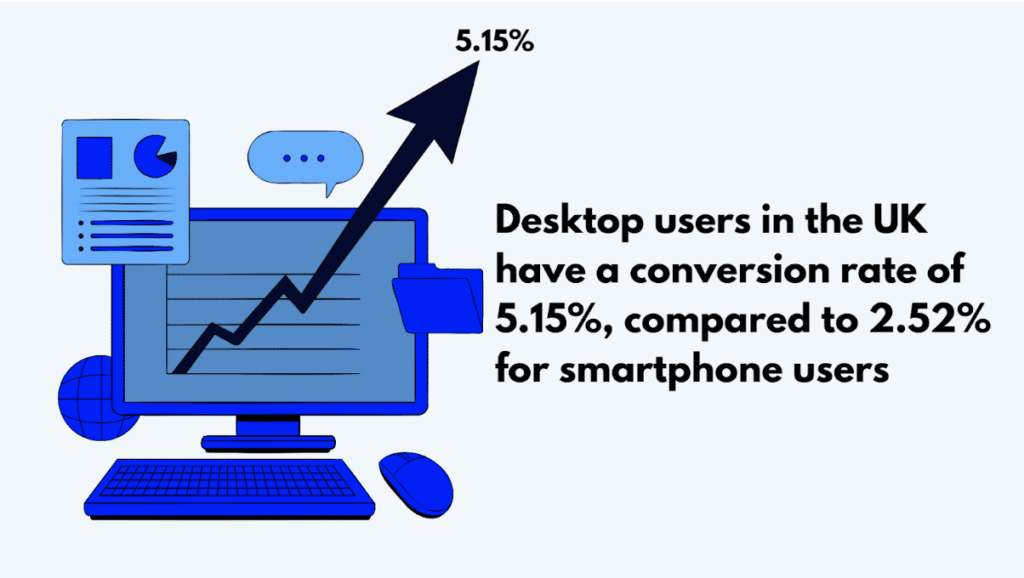
This suggests that while browsing is popular on mobile devices, purchases are often completed on desktops.
Average Order Value in UK M-Commerce
In Q2 2022, the average order value (AOV) for online purchases via desktop was approximately $126.5, compared to $86.3 for purchases made on mobile phones³.
UK Retail App Usage
On average, individuals spend 4.8 hours daily on their mobile phones⁴.
Time spent on shopping apps increased by 10% to 109 billion hours in 2022⁵.
Sources: Statista¹, Toppan Digital², Statista³, BBC⁴, eCommerceDB⁵
UK E-commerce Marketing Overview
Average E-commerce Spending in the UK
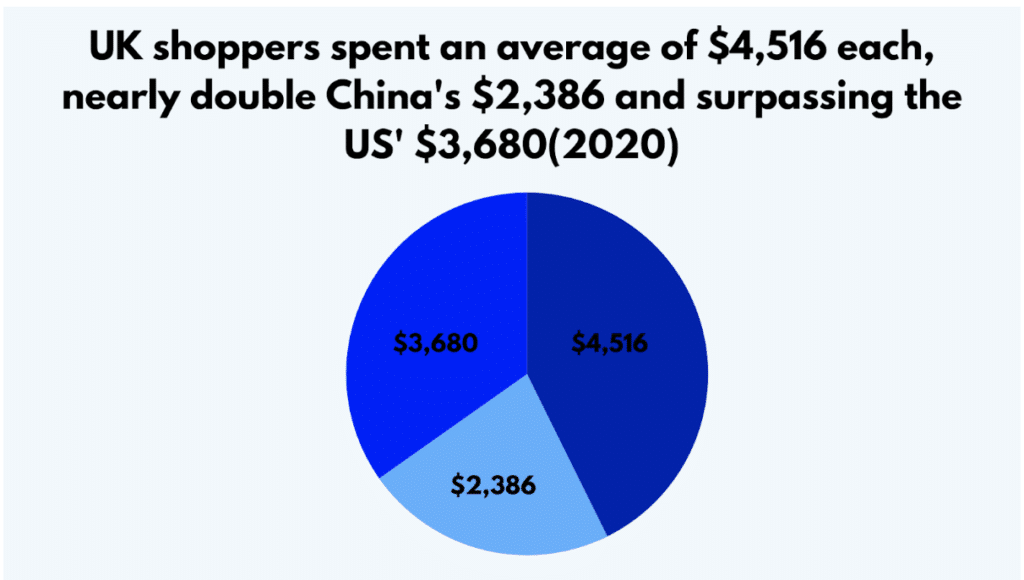
In 2020, UK shoppers spent an average of $4,516 (£3,250.1) each, nearly double China’s $2,386 (£1,717.1) and surpassing the US’ $3,680 (£2,648)¹.
Social Media Shopping in the UK
Approximately 80% of UK consumers used social media for shopping in 2021².
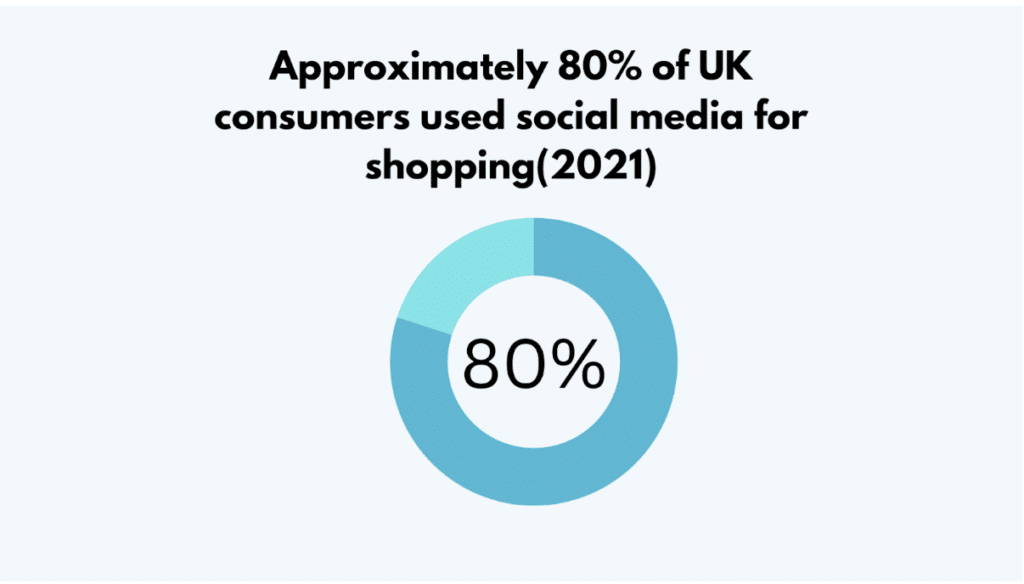
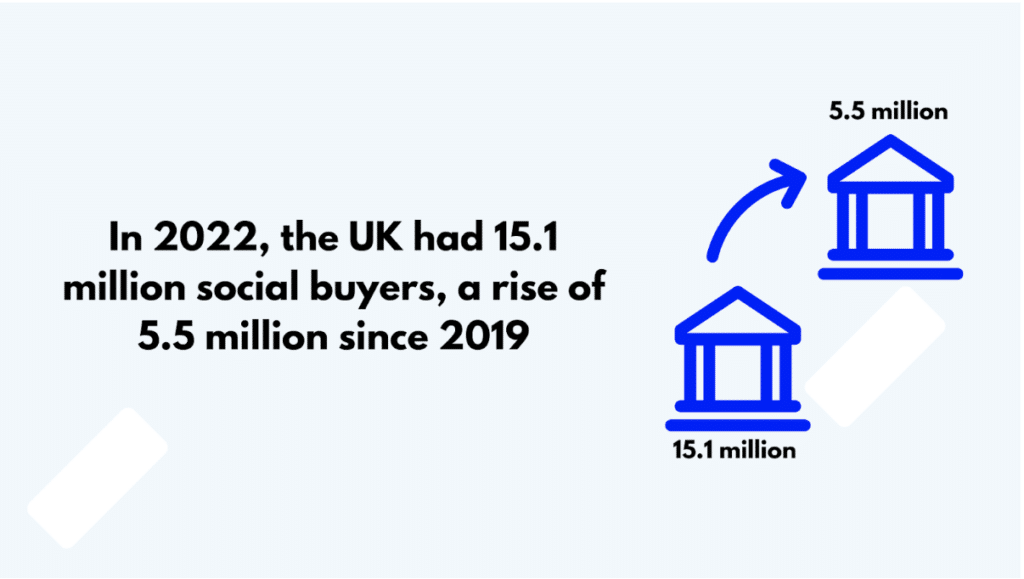
By 2022, the number of social buyers in the UK had increased to 15.1 million, up 5.5 million from 2019³.
E-commerce Advertising in the UK
In 2022, 65% of UK e-commerce ad spend was allocated to Meta’s Facebook and Instagram, 22.9% to Google, and 4.3% to TikTok⁴.
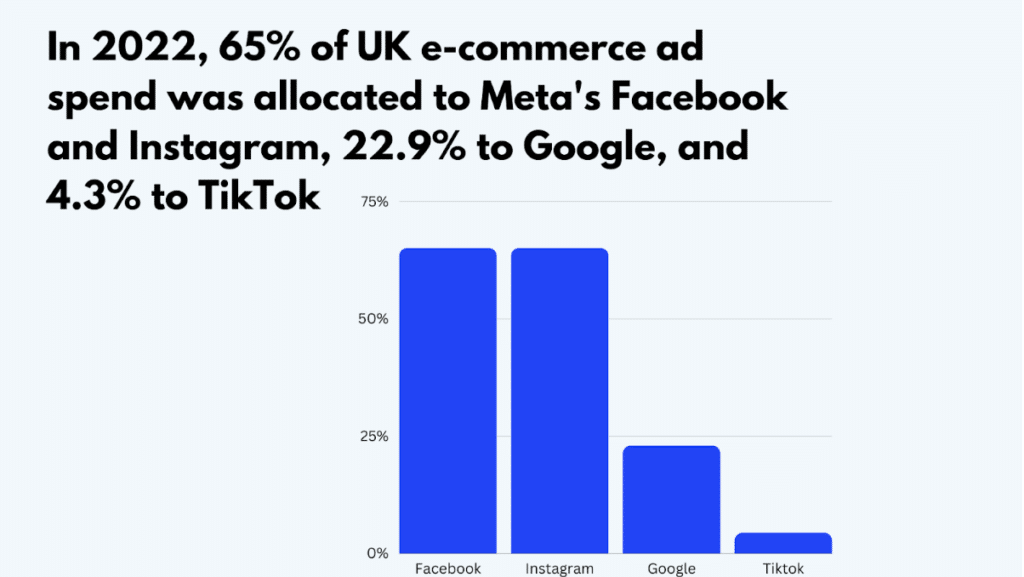
The same year, 14.72% of advertised products were out of stock in the UK, below the global average of 16.66%⁵.
Sources: Merchant Machine¹, Research and Markets², Insider Intelligence³, Charged Retail⁴, DataFeed Watch⁵
UK Regional E-commerce Overview
Top UK Regions for Online Shopping
The UK’s advanced e-commerce market generates annual online retail sales of $131 billion. The leading regions for online shopping are¹:
- Reading
- Bristol
- Brighton
- Edinburgh
- London
These regions were evaluated based on various factors including business closures, high street vitality, offline spending, postal and courier complaints, broadband speed, and average salary.
Number of E-Commerce Websites in the UK
Approximately 580,000 websites in the UK are enabled for e-commerce².
Online Shopper Population in the UK
In 2021, 82% of Brits, or over 55.2 million people, made at least one online purchase³.
E-commerce Conversion Rate in the UK
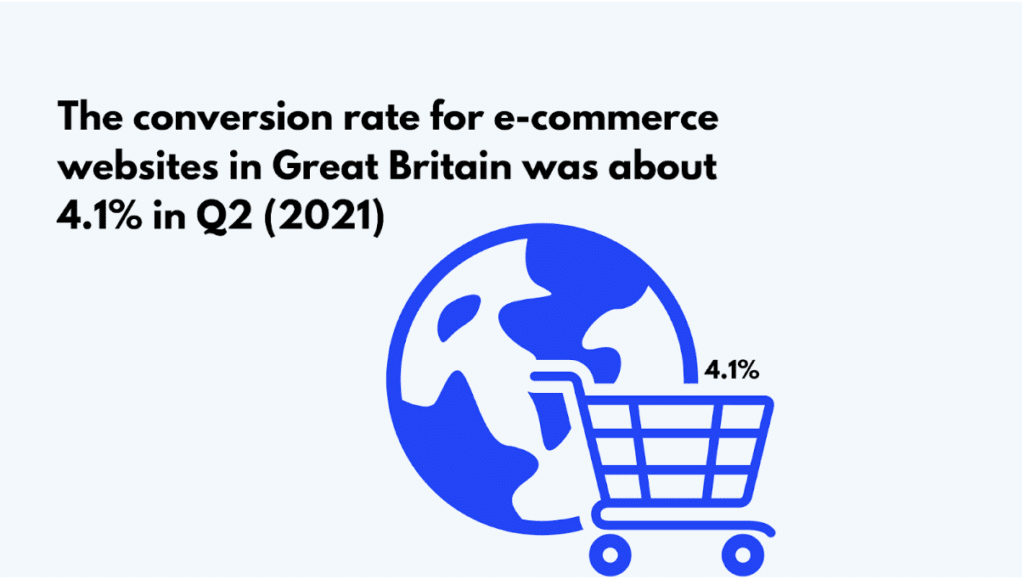
The conversion rate for e-commerce websites in Great Britain was about 4.1% in Q2 2021⁴.
Cart Abandonment Rate in the UK
In Q4 2022, the cart abandonment rate in the UK was roughly 80% for mobile orders and 70% for desktop orders⁵.
E-commerce Return Rate in the UK
The return rate for clothing and footwear stands at 19.9%, and for electronic products, it’s 6.2%⁶. The average e-commerce return rate in the UK is around 15%⁷.
Sources: Mollie¹, TAMI Report², International Trade Administration³, Statista⁴, Statista⁵, ShippyPro⁶, IMRG⁷
Reasons for Shopping Online Statistics in the UK
Key reasons and motivations for online shopping among UK consumers during 2018 to 2020 include¹:
- Price Comparison: A slight decrease from 55% in 2018 to 53% in 2020 suggests other factors are becoming more influential, despite the continued importance of price comparison.
- Product Variety: The consistent figures, 52% in 2018 to 51% in 2020, indicate that a wide product range remains a steady draw for online shoppers.
- Ease of Search and Purchase: The rise from 45% in 2018 to 49% in 2020 indicates an enhanced user experience on e-commerce platforms.
- Cost Savings: A minor drop from 44% in 2018 to 43% in 2019 might reflect online retailers’ efforts to balance price with value.
- Comfort of Home Shopping: The unchanging figure of 44% from 2018 to 2020 highlights the enduring value of convenience in online shopping.
UK E-Commerce and Digital Wallet Usage
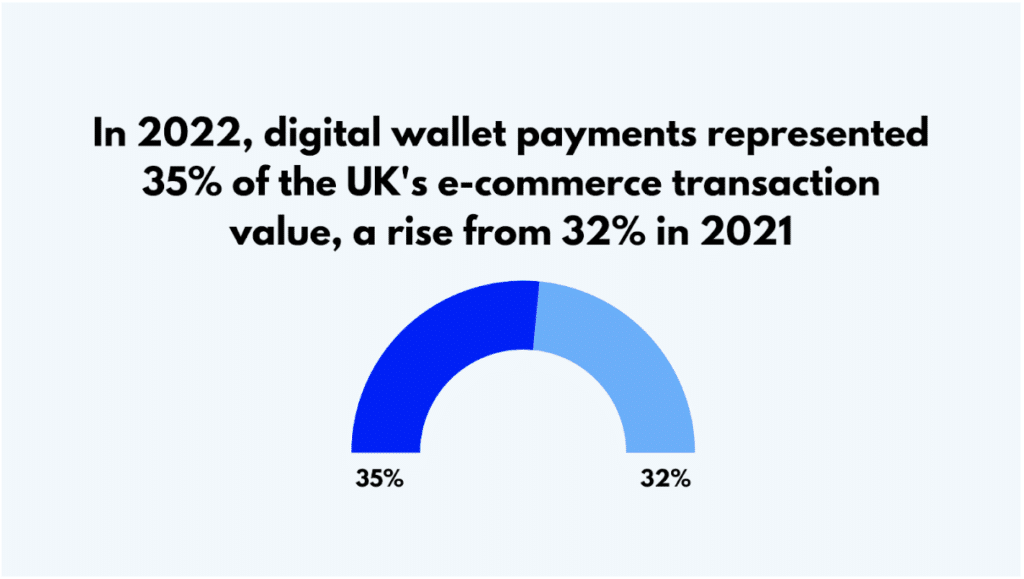
In 2022, digital wallet payments represented 35% of the UK’s e-commerce transaction value, a rise from 32% in 2021².
Mobile wallets have become the preferred payment method for online shopping, with PayPal leading as the most used digital wallet².
UK Digital Banking Trends in E-commerce
By 2023, digital-only bank accounts were held by 24% of Brits, a significant increase from 9% in 2019³. In 2022, an estimated 93% of Brits used online banking³.
The surge in digital banking is largely attributed to the younger demographic, with 85% of 18-24-year-olds and 79% of 25-34-year-olds utilising mobile banking apps⁴.
Shipping Statistics: Methods and Costs
Click & Collect is the most popular shipping method in UK e-commerce, used by 51% of the top 500 online shops in 2020⁵.
Royal Mail and DPD follow at 38% and 26% respectively⁵. Rising shipping costs are a major concern for 48% of UK e-commerce brands, posing a significant risk to business growth⁶.
Delivery Times and Free Shipping
In 2019, 65% of leading UK online retailers offered free delivery, while 23% charged for it⁷.
UK shoppers show a stronger preference for at-home delivery than the global average by 10%⁸.
Consumer Preferences
Free delivery significantly influences UK consumers’ online shopping decisions. A negative delivery experience can deter 70% of UK consumers from shopping with a retailer again⁹.
Sources: Statista¹. FIS’s Global Payments Report², Finder³, UKFinance⁴, Statista⁵, Charged Retail⁶, Statista⁷, PYMNTS Survey⁸, and Metapack⁹.
UK Emerging E-Commerce Trends and Technologies
NFTs (Non-fungible Tokens) in E-commerce
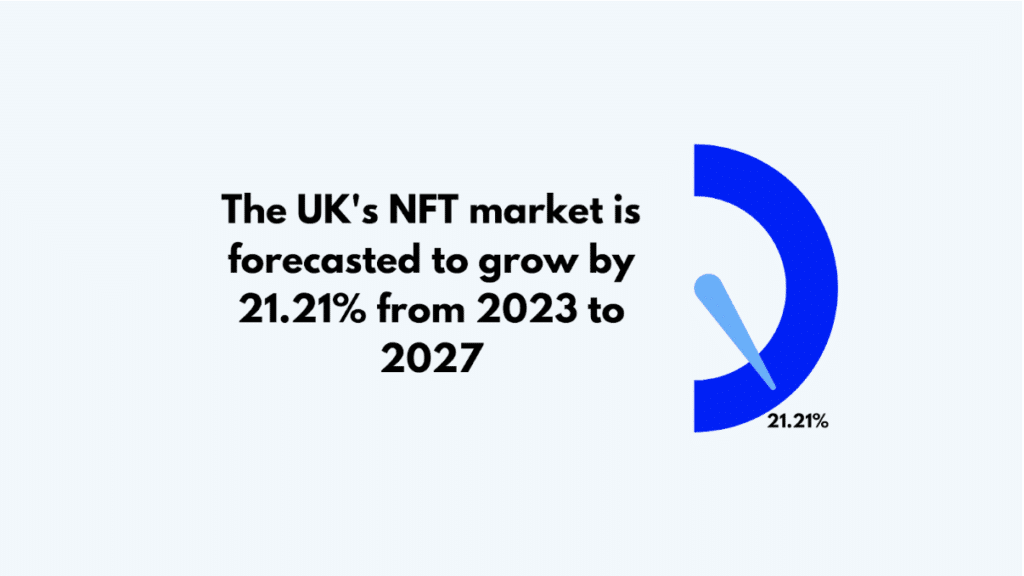
The UK’s NFT market is forecasted to grow by 21.21% from 2023 to 2027¹.
NFTs have seen a surge in popularity across various sectors, including gaming and art.
Augmented Reality (AR) Statistics UK
The increasing popularity of emerging e-commerce technologies suggests a growing role for AR in the UK e-commerce market. AR enhances online shopping by enabling customers to visualise products in their environment before purchasing, potentially increasing customer satisfaction and conversion rates.
Social and Livestream Commerce Statistics UK
In 2022, the UK had 15.1 million social buyers, a rise of 5.5 million since 2019².
Despite this, social commerce remains nascent, with less than a quarter of the UK population shopping via social media². TikTok Live was the preferred live shopping platform for nearly 30% of UK adults in 2022³.
Voice Shopping Statistics UK
By 2022, smart speakers were expected in 48% of UK households, with voice shopping predicted to hit $40 billion⁴. Approximately 40% of UK consumers reportedly use voice search for retail purposes⁵.
Recommendation Systems Statistics UK
Recommendation systems, integral to e-commerce for delivering personalised customer experiences, are gaining traction in the UK. While specific UK data is unavailable, the rising use of AI-powered chatbots and IVAs suggests a growing prevalence of recommendation systems in the UK e-commerce market.
Chatbots and Intelligent Virtual Assistants (IVAs) Statistics
As per an Oracle study, 80% of businesses intended to implement chatbots by 2020.
The global intelligent virtual assistant market was projected to grow from USD 7.01 billion in 2021 to USD 47.57 billion by 2028, propelled by the widespread adoption of chatbots⁶.
Sources: Statista¹, Insider Intelligence², Statista³, ReadyCloud⁴, Vixen Labs⁵, and Globe Newswire⁶.
UK E-Commerce Fraud and Security Statistics
Common E-commerce Frauds in the UK
The UK frequently encounters e-commerce frauds such as¹:
- Payment and identity theft fraud
- Friendly fraud
- Affiliate fraud
- Clean fraud
- Interception fraud
Number of Online Shopping Frauds in the UK
In H1 2020, the UK reported 62,868 consumer frauds, with approximately 41 thousand being online shopping and auction fraud². These frauds saw a 37% increase from H1 2019 to H1 2020².
Online Payment Fraud and Scam Statistics UK
Online payment fraud involving UK-issued cards rose by 27% in 2018 from 2017, costing over £251 million ($400 million) on UK retailer websites³.
Statista reports a 14% annual growth in online payment fraud, with projections indicating payment card fraud losses could reach $49 billion by 2030⁴.
Strategies to Counter Online Fraud and Cybercrime in UK eCommerce
UK eCommerce businesses can mitigate online fraud and cybercrime by⁵:
- Employing a robust fraud detection and prevention system
- Utilizing multi-factor authentication for user accounts
- Monitoring transactions for irregular patterns and flagging suspicious activities
- Educating employees and customers on online fraud risks and scam recognition
- Regularly updating and patching software and systems to guard against known vulnerabilities
- Collaborating with law enforcement and industry peers to share information on emerging threats and fraud prevention best practices
By staying updated on fraud trends and enforcing strong security measures, UK eCommerce businesses can enhance their protection against online fraud and cybercrime.
Sources: Fashion Capital¹, Statista², Ravelin³, Statista⁴, and The Good⁵
Conclusion
The 2023 UK Retail Report revealed a continued and accelerated trend toward e-commerce, with online shopping experiencing unprecedented growth due to evolving consumer habits and ongoing digital transformations. The UK has witnessed a significant shift in retail dynamics as more consumers prefer the convenience and safety of online shopping. New-age technologies such as AI, AR, and VR are reshaping the customer experience while retailers are increasingly adopting omnichannel strategies to stay competitive.