Technical analysis presupposes the efficient market hypothesis. That’s not a far assumption in the small cap arena.
It will be of no surprise to long term readers here at Investing Strategy that I am a student of fundamentals rather than technical analysis. Partially, this is because despite having worked alongside some of the best technical analysts in the UK over the past few years on various projects, I am not entirely convinced that the entire ‘science’ is actually grounded in fact.
But my personal opinion is really neither here nor there. Proponents of technical analysis, many of whom are either colleagues or friends, argue that instead of considering industry fundamentals the future price of an asset can be guessed by looking at a line on a chart and hoping there’s a method to the madness of pattern recognition.
Personally, I prefer to analyse companies by considering the following fundamentals:
- Financials — including the balance sheet, income, and cash flow
- Earnings growth — historical and projected earnings
- Margin — profitability of the revenue
- Valuation — p/e, p/s, and dividend yield
- Management — is the CEO/CFO/Chair competent/trustworthy?
- Rivals — market share, economic moat, advantages
- Macroeconomy — monetary and fiscal policy
- Risks — geographical, legal, company-specific
This isn’t an exhaustive list, but hopefully you get the idea. The key point is that fundamental analysis relies on the assumption that a stock’s price doesn’t fully reflect the value of the company when compared to publicly available data. In the long run — and this can be years — the stock price will reflect the fundamentals; hence I refer to myself as a long-term investor.
By contrast, technical analysis assumes the ‘efficient market hypothesis,’ which in essence suggests that stock prices reflect all publicly available information, including the above fundamental factors alongside sentiment. As a result, the idea is that analysing price patterns and trends can provide insight into future movements.
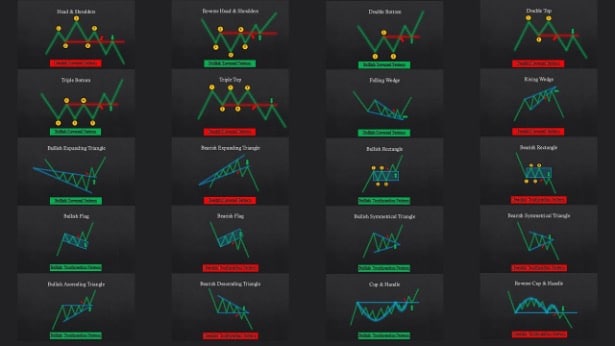
You will have heard the usual terms, and most will have a rudimentary understanding. Support and resistance levels, breakouts, breakout confirmation, moving averages, Fibonacci retracement, Bollinger Bands, relative strength index, MACD, oscillators, breakdowns, head and shoulders, double tops, triangles, wedges…
The list goes on and on. If you decide to engage in leveraged trading, there’s even more technical jargon — trading strategies like long strangles, iron condors, and the long butterfly spread. The more it sounds like it came straight out of the Jabberwocky, the better.
However, there is a reason I rarely consider technical analysis — which is that I tend to focus on small cap stocks where the pillars on which technicals are supported seem weak. By contrast, I fully accept that blue chip technical analysis is perhaps possible for individuals with a lot of skill garnered through real life experience.
But why? Technical analysis is built on several presumptions, all of which do not apply to AIM shares in my view.
First, take the idea that market prices reflect all available information. With blue chips like Apple or Tesla, where dozens of analysts are covering every conceivable angle, this is a perfectly reasonable assumption.
With an AIM share like PREM, HARL, GGP etc, there is at best surface level analysis by the mass media — and shareholders are comparatively uninformed. I’d venture that very few FTSE AIM lithium investors truly understand the Chinese lithium market, and yet all the information is publicly available for those with enough time.
Second, technical analysis presumes that historical price patterns and trends tend to repeat, meaning you can forecast future price movements. The idea is that fear and greed is intwined with market psychology such that movements can be predicted. Again, this is a reasonable assumption with blue chips, but not with penny shares.
This is because many AIM companies like AVCT, PREM, BOIL etc, all have their share prices dictated by one flagship asset. And often, the aim of these companies is to sell the flagship asset for multiples of the share price — this only happens once, and often without warning.
PREM sells Zulu, AVCT gets bought out by AstraZeneca, BOIL enters into a JV with Chuditch, GGP buys out the entirety of Havieron — and all the Bollinger Bands in the world won’t save you if you’re short without a stop loss.
Third, technical analysts presume that supply and demand are the key drivers behind share price movements, such that if you analyse price and volume (how often shares are changing hands) data you can predict changes of supply/demand to predict price movements.
This doesn’t really work in practice within the small cap space, as low volume doesn’t mean a company is undesirable — especially if there are large gaps between relevant news. Shareholders are often just holding on to their assets, only buying or selling on the next piece of news.
Finally, technical analysts can only generate decent profits by riding out a trend until new evidence suggests that there will be a reversal. For example, if you see a downtrend, you leave a short trade position open until the technicals suggest a reversion to the mean — at which point you exit. The problem with this is that unlike a blue chip, a singular positive or negative RNS can send the share price soaring or tanking, in a way that is rare among blue chips outside of earnings season.
Of course, as a proponent of fundamentals over technicals, it’s likely that I have some strong bias. Of course, there will be some technical traders making tons of profit. But even as a high-risk investor, I know that trading on leverage and forsaking the SIPP and ISA tax shelters, is perhaps not the best idea.
For context, roughly 75% of retail accounts lose money when trading spread bets or CFDs — it’s written in bold writing on every UK leveraged trading website before you open an account, so you can’t say you aren’t properly warned.
And if you’re in for long-term investing over several years, the fundamentals eventually shine through.
At least, that’s the theory.
This article has been prepared for information purposes only by Charles Archer. It does not constitute advice, and no party accepts any liability for either accuracy or for investing decisions made using the information provided.
Further, it is not intended for distribution to, or use by, any person in any country or jurisdiction where such distribution or use would be contrary to local law or regulation.