In the UK, commuting is essential to many people’s daily routines. As a matter of needs, understanding the average commuting cost is vital for individuals and businesses. Commuting expenses can include car expenses, biking expenses, and public transportation costs.
In this report, we will provide an insightful analysis of the cost of commuting in the UK in 2023 and discuss its importance for individuals and businesses. Understanding these costs will help individuals make better decisions about their transportation options. Also, companies can develop strategies to support their employees and improve overall job satisfaction.
Commuting Key Statistics
- 64% of UK respondents use their own or household car as the most common mode of transportation for commuting
- The average commute distance for a single occupancy car journey in the UK is 19.5 miles
- The average current UK fuel price is £1.75 per litre, and the average car consumption is 40 miles per gallon, resulting in a round-trip cost of £7.80 per day for car commuters
- Public transport in UK cities is the most expensive in Europe, with bus users facing significant price rises in 2023
- The average usual commuting time in Great Britain was 27 minutes in 2021
- On average, people in England made 703 trips using private transport, while 53 used public transport modes in 2021
- About two-thirds of Londoners pay £20 or more a week to commute, with an average cost of £64.19
- The UK financial year ending (FYE) 2022 recorded 5.1 billion passenger journeys made on public transport vehicles, 3.1 billion local bus passenger journeys, and 1.7 billion trips made by rail
- Total passenger revenue in Great Britain for the quarter from January to March 2023 was £2.2 billion
- UK commuters spend an average of £17.23 a day to commute to and from work
- A May 2023 survey of 1,000 UK commuters revealed that a significant number of people are borrowing money to pay for their commute
- 32% of UK respondents have a daily commute duration of 15 to 29 minutes
Modes of Transportation in the UK
In the UK1, there are two most common patterns for citizens to commute from one destination to the other. These two modes are using; an owned or household car and public transport.
Owned or Household Car
In the UK, the registered keeper of a car is defined as ‘the person who is responsible for the vehicle and has the right to use it.’ This can be different from the actual owner of the car, who is the person who purchased the car or received it as a gift. The registered keeper is responsible for ensuring the vehicle is taxed and holds the details on the V5C documents of the car.
Statistics of Household Car Ownerships in the UK
In 20212, approximately 25.6 million individuals in the United Kingdom resided in households owning a single car.
In the same year, 20212, almost nine million British lived in a house with two cars, an increase over the preceding year.
More than 17 million people in the United Kingdom lived in a household with no car in 20212.
Average Household with Cars in the UK
In the UK, the average number of households with cars is 1.213.
Most Used Type of Cars by Households in the UK
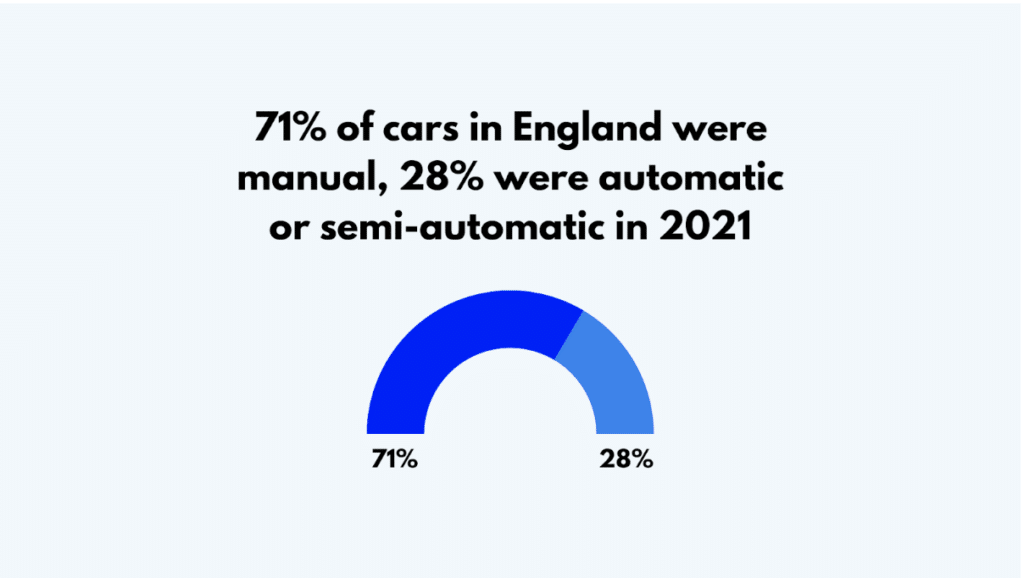
In England, 71% of cars owned were manual, and 28% were automatic or semi-automatic in 20214.
64% of cars owned by the majority in England were petrol fuel type in 20214.
Statistics of Car Ownership Based on Regions in England
The East of England recorded the highest number of household car ownership, with an average of 1.45 car owners per household.
London has the least record of household car ownership, with an average of 0.85 cars per household.
Public Transport Users
Public transport in the United Kingdom is crucial in connecting millions across the country. The network comprises bus, metro, trams, trains, and taxi services. However, this study will focus on statistics for buses, trains, and taxis users exploit.
The total number of passenger journeys made in the UK in 2021 was 5.1 billion6.
Statistics on Users By Bus
There were 3.1 billion passenger trips on local buses in the UK in 20216.
Statistics on Users By Trains
By train in the UK, in 20216, 1.7 billion passengers made journeys through the rail system.
Statistics on Users By Taxis
In the UK, the Uber market makes up approximately 35 million7 users.
Comparisons: Private Car Ownership vs Public Transport Users
| Features | Private Car Ownership | Public Transport Users |
| Cost | Higher | Affordable |
| Convenience | Flexible | Fixed routes |
| Space | More comfortable | Less comfort |
| Commute time | Faster | Steady |
| Maintenance | High charges | No charges |
| Social Interaction | Limited opportunities | Vast opportunities |
| Stress and Relaxation | Stressed in traffic | Relaxed in traffic |
| No. of commuters | 25.6 million2 | 5.1 billion6 |
Factors to Consider Between Choosing Owning a Private Car or Using the Public Transport in the UK
When deciding between owning a private car or using public transport in the UK, there are several factors to consider. These factors include cost, convenience, environmental impact, safety, and personal preferences.
- Cost
Owning a private car comes with expenses such as fuel, insurance, maintenance, and parking charges. On the other hand, public transportation fares are typically based on travel distance or zone, and monthly or annual passes can provide even greater savings.
- Convenience
Private cars offer flexibility and control over travel times and routes, while public transport operates on fixed schedules and routes. However, public transportation can help avoid traffic jams and parking issues in congested urban areas.
- Safety
Public transport typically has high safety standards and protocols. However, during health concerns, such as a pandemic, using private cars can offer a more hygienic option by limiting exposure to many strangers.
- Personal Preferences
Some people prefer the privacy and comfort of their car, while others enjoy the opportunity to work or relax while commuting on public transport.
Sources: Statista1, Webuyanycar, AXA, Statista2, Review423, GOV.UK4, Statista5, GOV.UK6, Taxi Insurer7,, Nationwide Vehicle Contracts, Environmental Conscience, Educba, Lewis Taxis
Average Cost of Commuting in the UK
People in the UK either commute using their privately owned cars or public transport. In this regard, let’s look at the average cost of each mode of transport in the UK.
Estimated Cost of Commuting by Car Owners
According to a 20211 study, the average annual cost of owning a car in the UK is £5,744.40.
The estimated cost of commuting by car in the UK varies depending on fuel prices, insurance, maintenance, and other expenses.
Estimate Based on Fuel Prices
The average cost of average fuel prices in the UK were around £191 per litre for petrol and £199 per litre for diesel in 20222.
Estimate Based on Insurance Cost
At the end of 20213, the average cost of comprehensive car insurance in the UK was £412.
Estimate Based on Maintenance Cost
On average, car owners in the UK spend approximately £2804 annually on vehicle servicing.
Estimated Cost of Commuting by Public Transport
A 20211 study shows that the average annual cost of the UK citizens who do not have a car is £3,406.80.
Estimate Based on Bus Fares and Fare Cap Scheme
In England, the average national bus fare is £2.806. The UK government introduced a £2.505 fare cap scheme for single tickets, from November 1, until November 30, 2024.
Estimate Based on Train Fare and Season Ticket
In the UK, the average train fare is £296 a ticket. With a 3.8% rise in train ticket prices, the UK’s average train season ticket cost is around £3,2637.
Estimate Based on Taxi Fares
In the UK, the average basic fee for a taxi is £3.008.
Impact of the Cost of Living Crisis on Commuting
The Cost of Living Crisis in the UK has significantly impacted commuting patterns and choices. As the cost of living continues to rise, people are looking for ways to save money, leading to changes in their commuting habits.
One of the main effects of the crisis on commuting is the potential shift towards public transport. As the cost of living increases, people may be more likely to choose public transport over private cars, which is often more affordable. However, this shift depends on the affordability of public transport fares.
For example, the Hopper fare allows unlimited bus and tram journeys within one hour for £1.759 in London. If public transport prices are not competitive, people may turn to other alternatives, such as electric cars or bicycles.
The crisis has also affected the mental and physical well-being of commuters. Over half of the commuters report increased stress levels due to their commute, and more than one-third say that their commute decreases the time they spend sleeping. The cost of living crisis may exacerbate these issues, as people may need to work longer hours or take on additional jobs to make ends meet, further impacting their well-being.
For disabled people, the cost-of-living crisis has made transportation even more challenging. Disabled individuals often face higher living and transport costs. More even, the rising public transport prices can be a significant barrier to accessing work, education, and social activities.
Sources: NerdWallet1, Rac2, Money Helper3, Bumper4, UK GOV5, Euronews6, City Monitor6, Birmingham7, TDC8, Passenger Transport, TFL9, RSPH, Transport for All
Best Cities for Commuters in the UK
London is the City with the most lucrative work and offers good employment opportunities to anywhere else in the UK. So, let’s study the best cities around places in London to commute. These cities are ranked based on time to the London city, season ticket prices and average house prices.
| Rank/Cities | Time to London | Season Ticket Price | Average House Price |
| 1. Hatfield, Hertfordshire1 | 23 minutes | £3,076 | £503,205 |
| 2. Reading, Berkshire1 | 23 minutes | £5,044 | £450,485 |
| 3. St Albans, Hertfordshire1 | 21 minutes | £3,952 | £638,486 |
| 4. Borehamwood, Hertfordshire1 | 22 minutes | £2,164 | £574,206 |
| 5. Iver, Buckinghamshire1 | 23 minutes | £2,468 | £600,639 |
Most Congested Cities in the UK
Factors like congestion, travel time, and overall commuting experience determine the worst cities in the UK. Here are some cities that stand out for their challenging commuting conditions:
| Rank/Congested Cities | Expected Travel Time (%) |
| 1. Edinburgh2 | 40 |
| 2. London2 | 37 |
| 3. Bournemouth2 | 34 |
| 4. Hull2 | 34 |
| 5. Belfast2 | 34 |
| 6. Brighton2 | 34 |
Sources: MoveIQ1, Fuel Genie2,
Strategies for Reducing Commuting Costs
Commuting costs can significantly affect how you spend on other basic needs. To trim costs, there are many ways you can do so. Some of which are:
- Consider alternative modes of transport: Cycling or taking the bus may be cheaper than using trains. Electric bikes have become popular and can provide the benefits of cycling without as much physical exertion.
- Utilize discounts and concessions: Various discounts and privileges are available for different age groups and people with disabilities. For example, the 16-25 Railcard offers up to 1/3 off rail fares for students aged 16-251 or full-time. Transport for London also offers free and discounted travel options for eligible individuals.
- Flexible working hours and remote work: Ask your employer for more flexible hours to avoid peak travel times and save on fares. Remote work can also help reduce commuting costs. Many remote job opportunities are available in the UK.
- Off-peak travel: Traveling during off-peak hours can be cheaper. For example, using pay-as-you-go during off-peak hours can save you money on public transport in London.
- Cycle to Work scheme: This allows you to pay for a bike gradually and tax-free, saving you money on transportation and gym memberships.
- Utilize the Government Fare Cap Scheme: The UK government set up a fare cap scheme to help the citizens bridge the amount they spend on transport. The scheme, which will cease to continue in November 2023, can help citizens save ¼ of the £22 they’re currently spending on transport.
Sources: Good Housekeeping, GOV.UK1, Transport for London, TFL, Bike Radar, GOV.UK2
Factors Affecting Commuters in the UK
Some factors affecting commuters in the UK are:
- Cost of commuting: UK commuters spend an average of £17.231 a day commuting to and from work. In London, the average cost of commuting is £64.192 per week.
- Traffic congestion: London, Bristol, and Manchester are among the most congested cities in the UK. The average driver in the UK lost 80 hours due to traffic congestion in 20223.
- Rising fuel prices: Increasing fuel prices have made commuting by car more expensive, potentially affecting the choice of transport mode for commuters.
- Regional disparities: Public transport in the north of England is particularly problematic. This is associated with reduced reliability and frequency of bus and rail services.
- Flexible working arrangements: The rise of remote and hybrid working due to the COVID-19 pandemic has led to changes in commuting patterns. In a survey, 49% of respondents commute a maximum of two days a week.
Sources: National Express1, Evening Standard2, Inrix3, Business Live, The Guardian, Mobility Ways
Conclusion
The average commuting cost in the UK is a significant financial burden for many workers. This is primarily due to the rising transportation costs, including petrol prices, public transport fares, and other essentials. In fact, research shows that UK workers pay more of their salary in commuting costs than their EU counterparts. Employers may need to consider offering financial incentives or other support like remote or hybrid working models to alleviate the burden of commuting costs for the workforce.